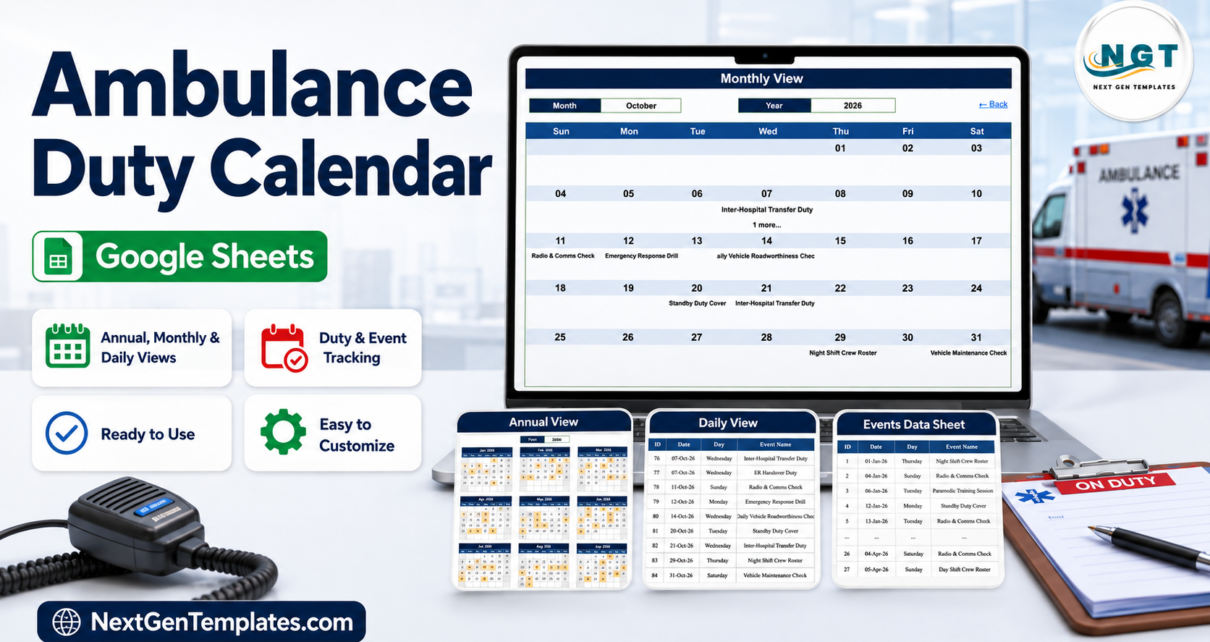
A formula-driven Google Sheets duty roster for ambulance stations: five tabs, three linked calendar views and 100 verified sample duties for 2026. No macros, no Apps Script.
Online Tutorial for Data Analysis and Automation
A formula-driven Google Sheets duty roster for ambulance stations: five tabs, three linked calendar views and 100 verified sample duties for 2026. No macros, no Apps Script.
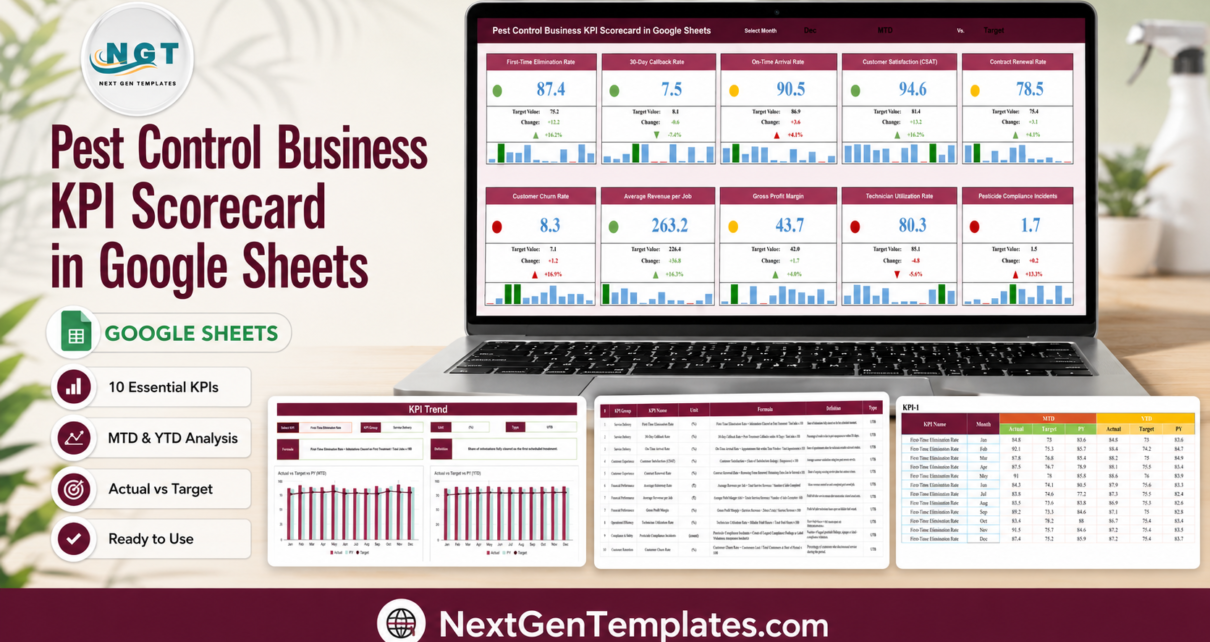
Track ten pest-control KPIs on one screen in Google Sheets – month picker, MTD/YTD against target or prior year, red/amber/green traffic lights, a KPI trend page and a written formula for every metric.
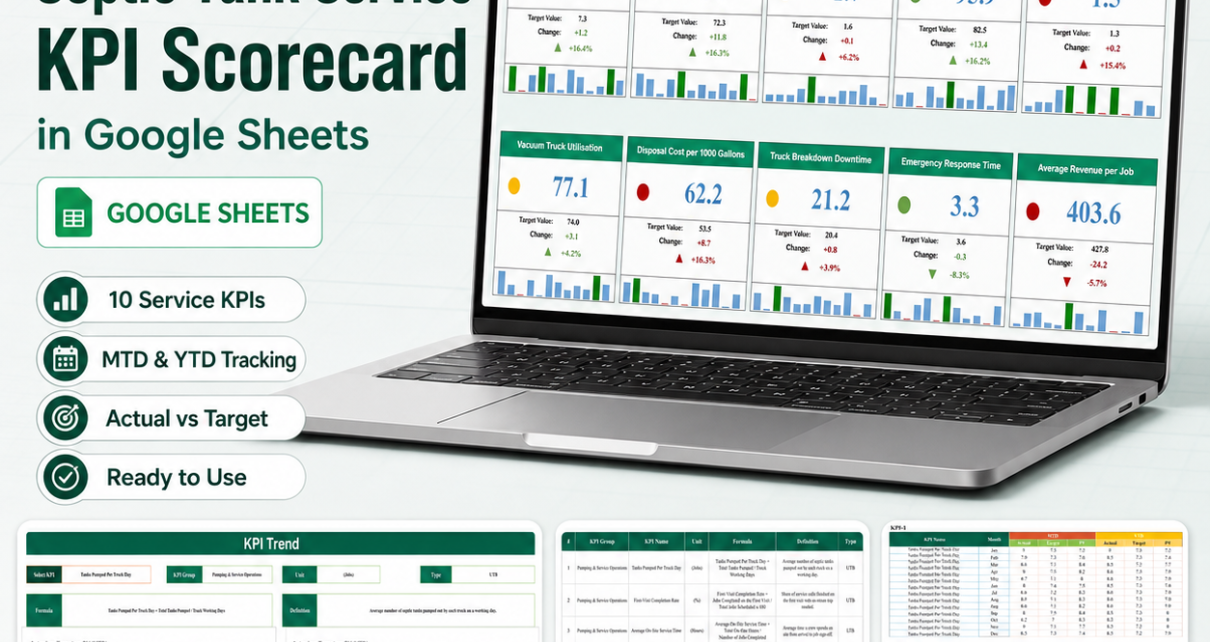
A month-picker scorecard that puts ten septic-service KPIs – pumping throughput, inspections, fleet, disposal cost, emergency response and revenue per job – on one Google Sheets screen with targets, arrows and traffic lights. Full walkthrough of all four pages, the December sample numbers, the known June/July month-label issue and its thirty-second fix.
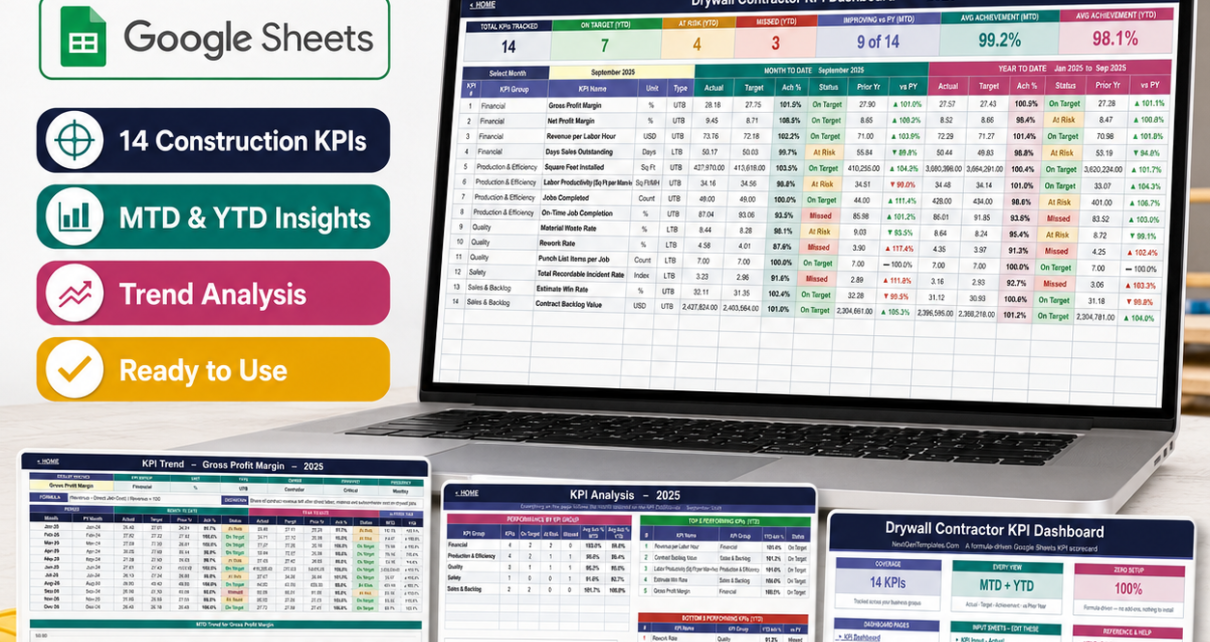
Track 14 drywall contractor KPIs in Google Sheets with MTD and YTD achievement, prior-year comparison, traffic-light status and a single month dropdown.
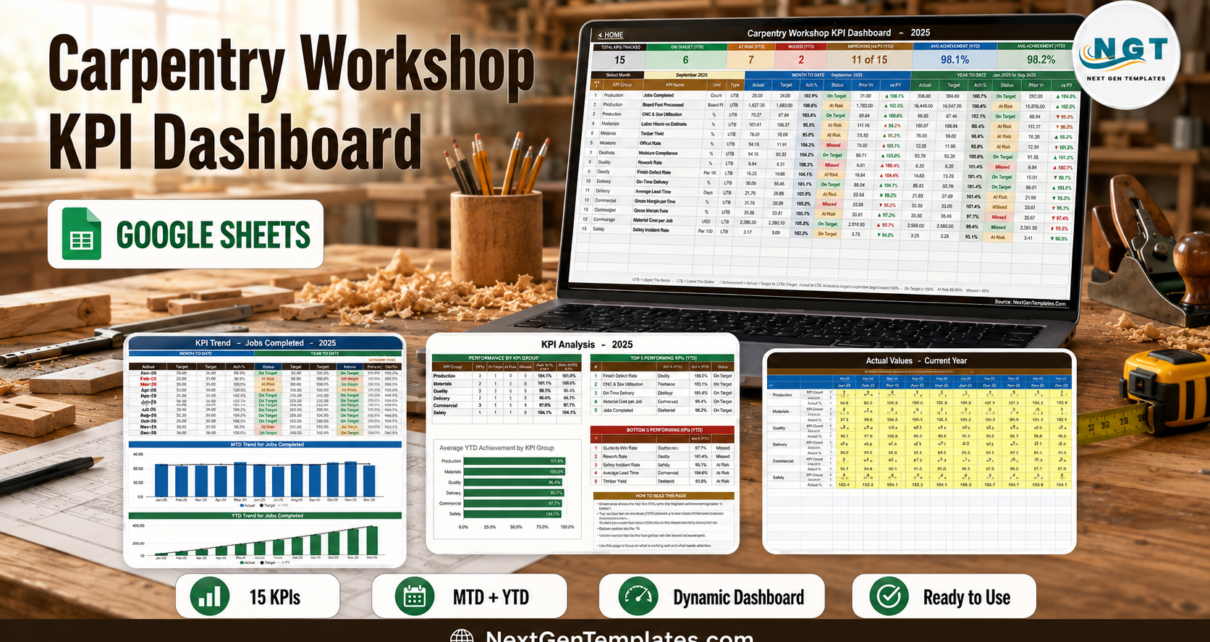
Track 15 carpentry KPIs in Google Sheets across Production, Materials, Quality, Delivery, Commercial and Safety – MTD and YTD, traffic lights, a month picker, a KPI Trend page and a KPI Analysis page, all worksheet formulas.
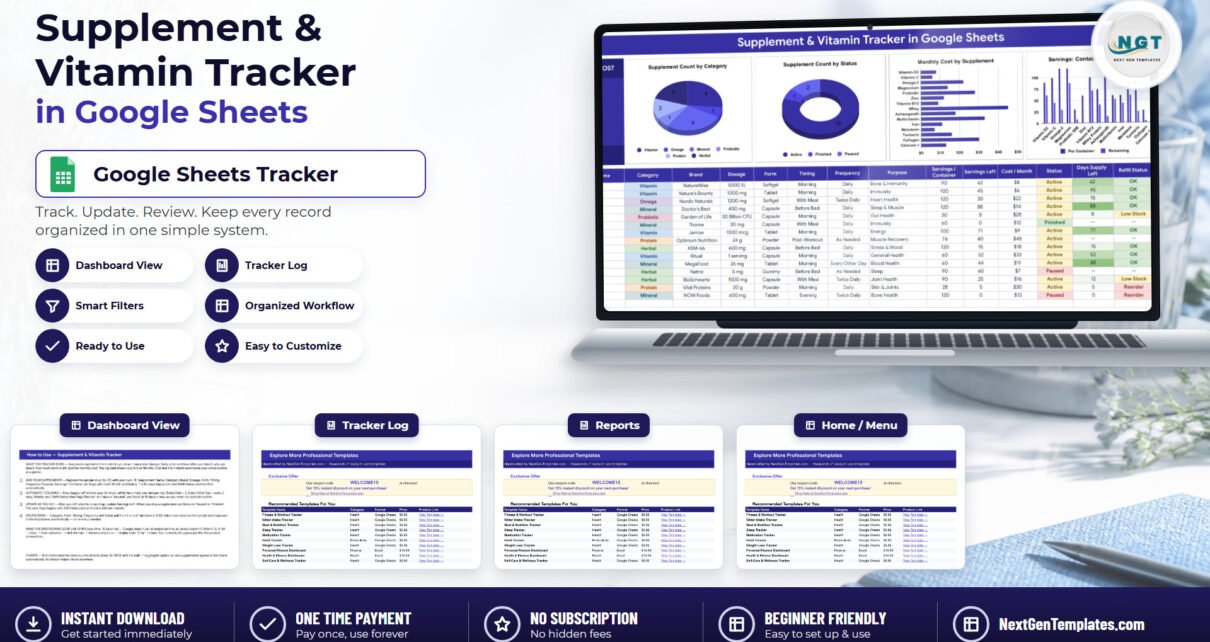
A Google Sheets supplement tracker with a 16-column log, a live Active Monthly Cost card, 4 charts and automatic Low Stock and Reorder flags at 14 and 7 days of supply.
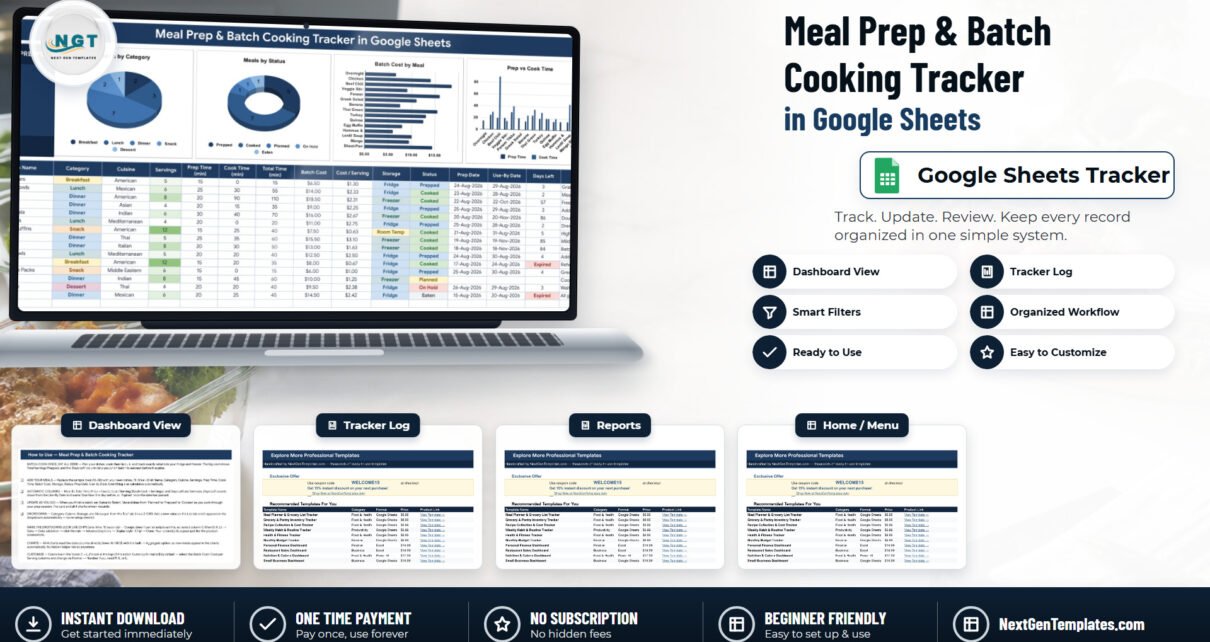
A four-tab Google Sheets tracker for batch cooking: a 16-column log with four automatic columns, cost per serving, a Days Left countdown on every Use-By Date, one KPI card and four live charts.
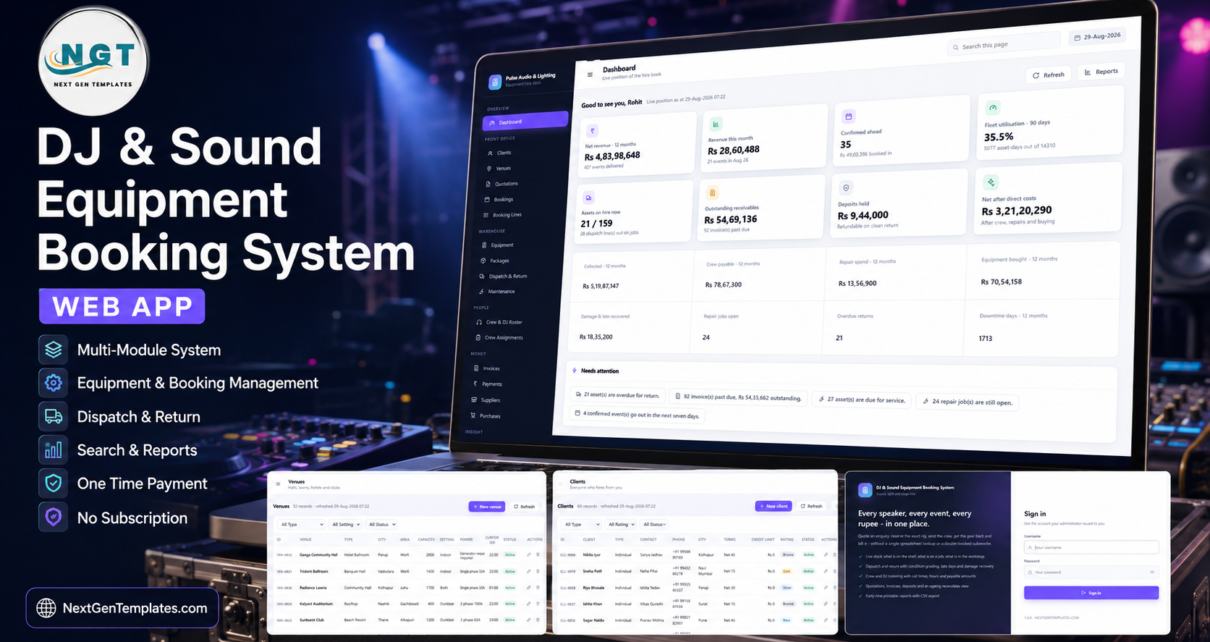
A full sound, light and stage hire desk in one Google Apps Script web app – 182 tagged assets, availability checks across a date window, dispatch and return with condition grading, crew rostering, invoices and 49 printable reports. Try the live demo with all nine seeded logins.
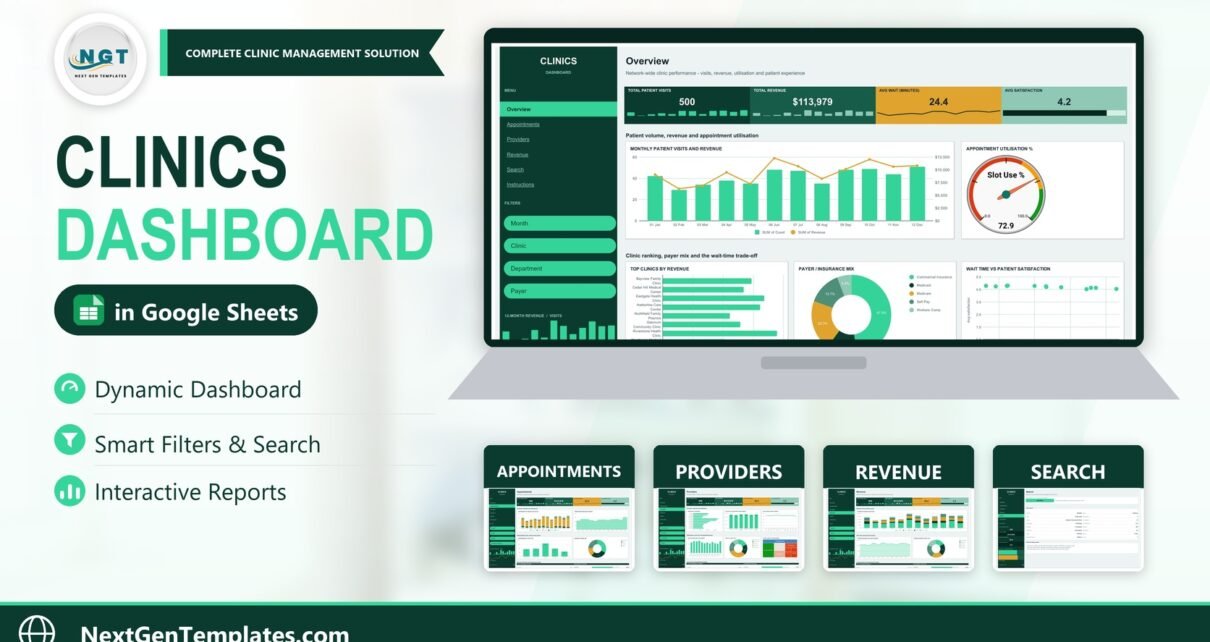
The Clinics Dashboard in Google Sheets turns one visit log into four report pages with 18 charts, 15 slicers and a Visit ID search – across 500 sample visits, 8 clinics and 12 providers, with no patient identifiers in the data model.
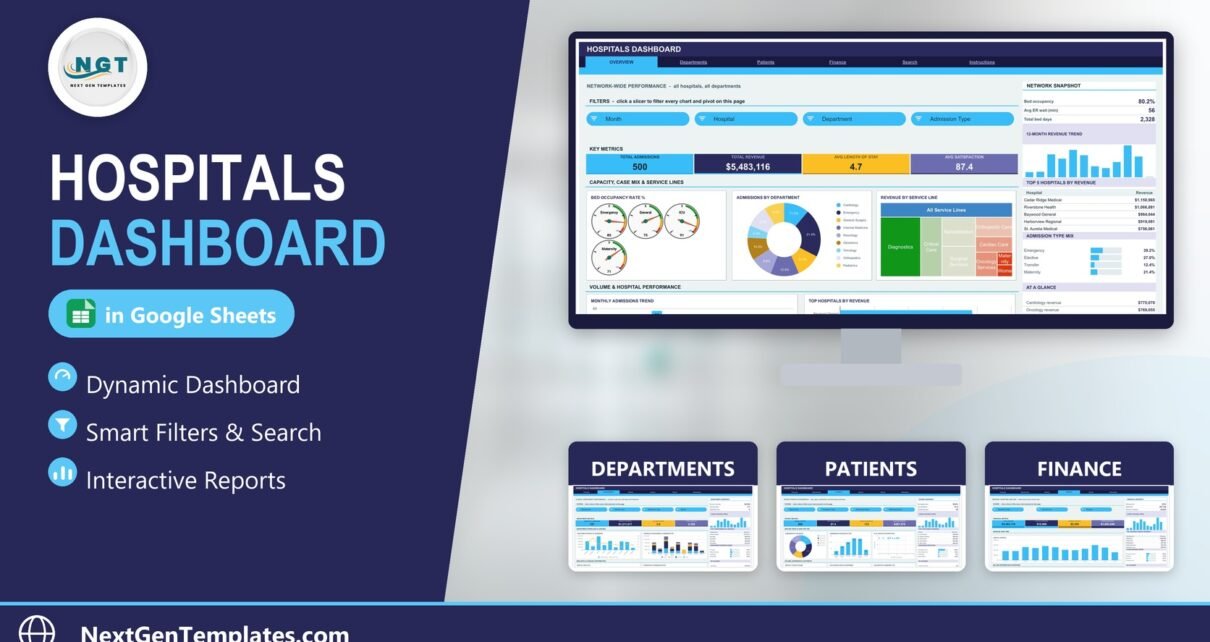
The Hospitals Dashboard in Google Sheets reports on an admissions log across six linked tabs – 16 KPI cards, 18 charts and 15 slicers driven by native pivot tables. A static reporting template: no EHR connection, no clinical data.