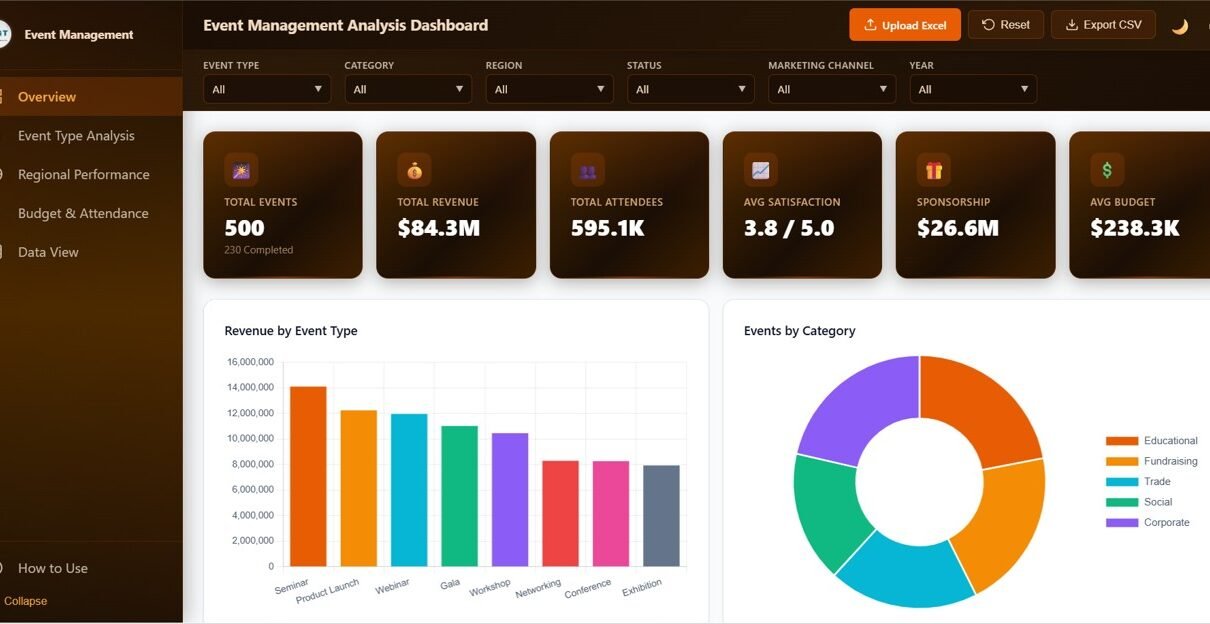
The Event Management Analysis Dashboard in HTML is a browser-based analytics template with 5 interactive pages — Overview, Event Type Analysis, Regional Performance, Budget & Attendance, and Data View — plus 6 KPIs and 20+ charts covering revenue, attendees, sponsorship, budget, and satisfaction. Works in any modern browser — no Excel or Power BI needed.
Tag: HTML Dashboard Template
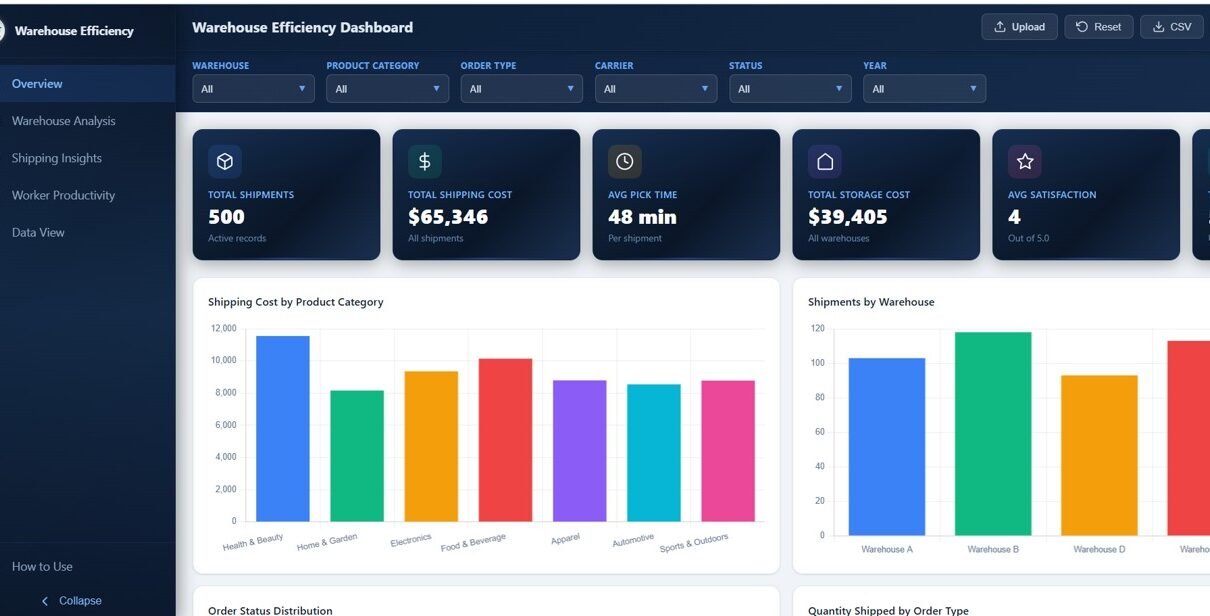
Warehouse Efficiency Dashboard in HTML
Warehouse Efficiency Dashboard in HTML with 5 interactive pages tracking shipments, storage costs, shipping insights, worker productivity, and a data view with CSV export.
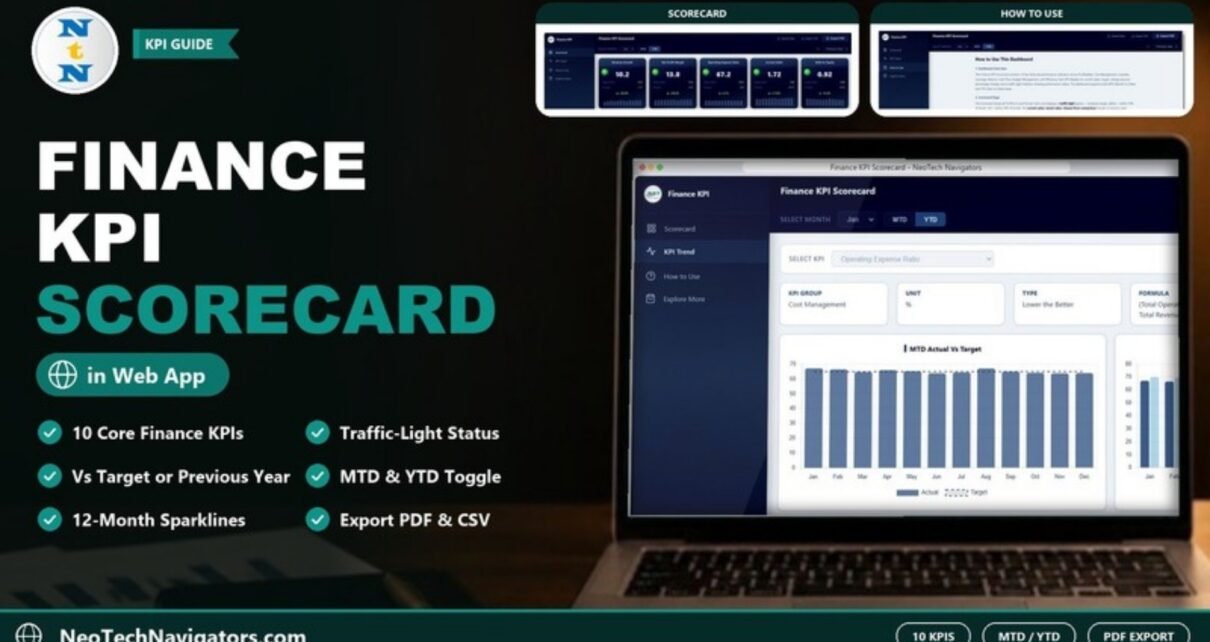
Finance KPI Scorecard in HTML
A browser-based Finance KPI Scorecard in HTML that shows ten financial KPIs with traffic lights, targets, prior-year changes, sparklines and four trend charts, with PDF and CSV export.
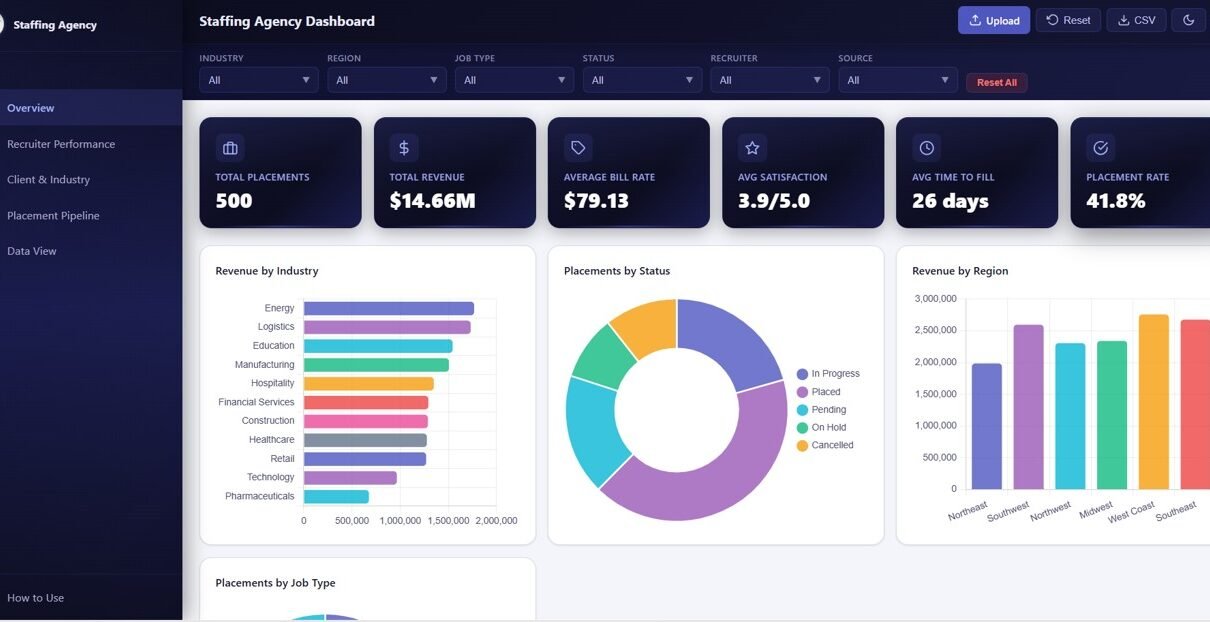
Staffing Agency Dashboard in HTML
Staffing Agency Dashboard in HTML with 5 interactive pages, 6 KPIs, recruiter performance tracking, client analysis, placement pipeline, data view, and CSV export.
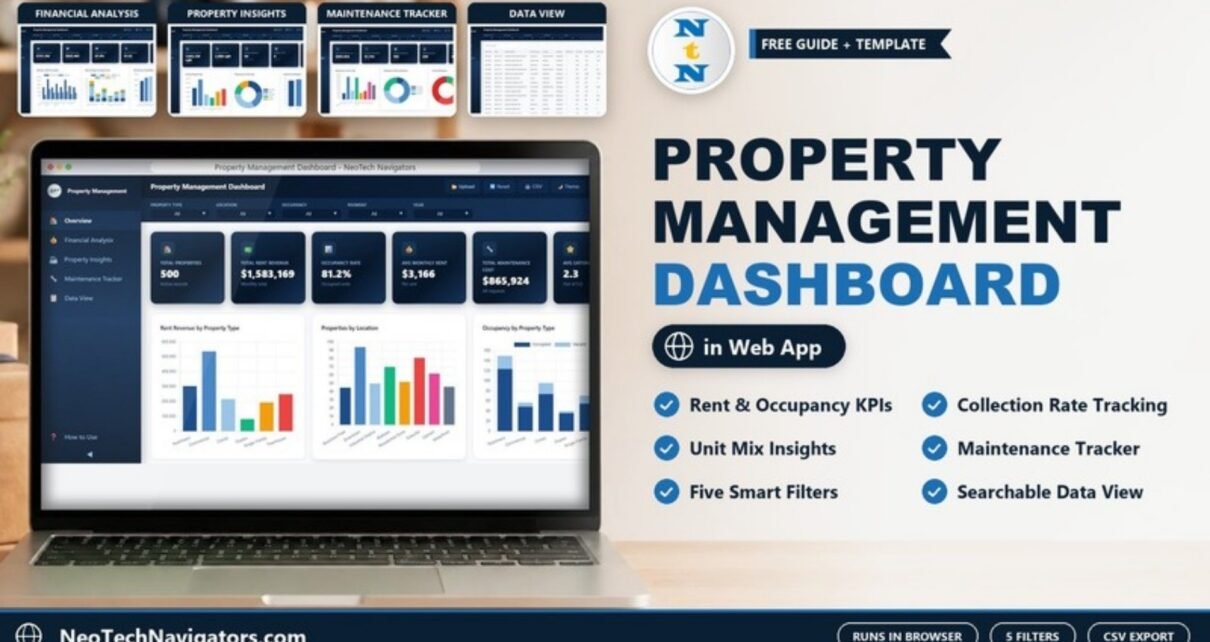
Property Management Dashboard in HTML
A page-by-page guide to the Property Management Dashboard in HTML: rent, collections, occupancy, unit mix and maintenance on five browser pages, plus how to load your own property data.
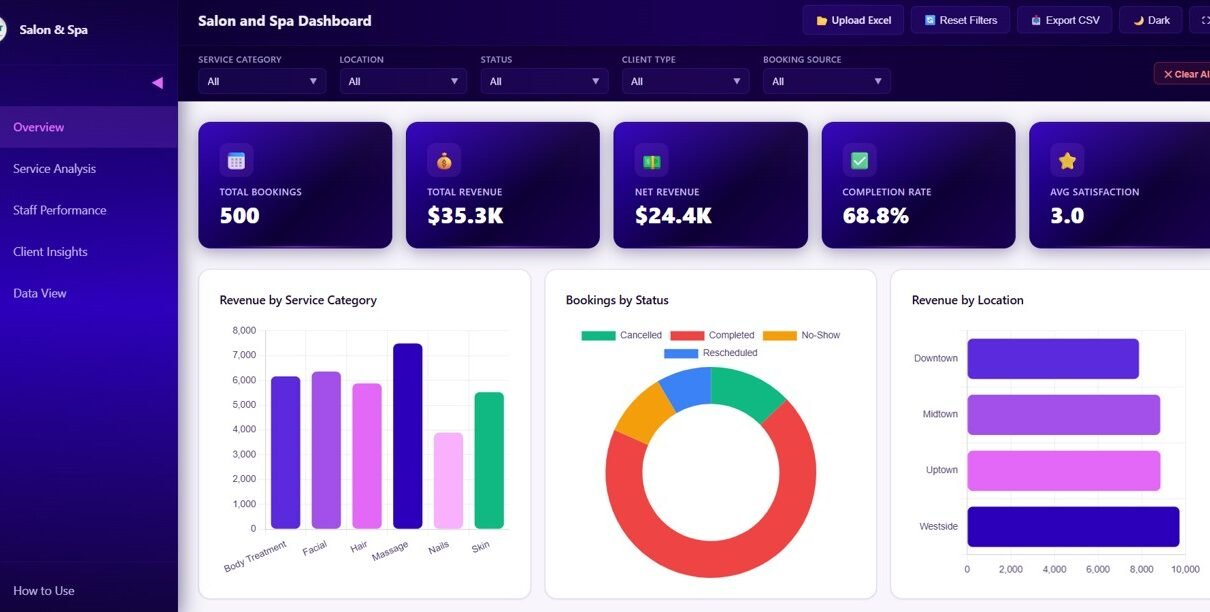
Salon and Spa Dashboard in HTML
Explore the Salon and Spa Dashboard in HTML — a browser-based analytics template with 5 interactive pages tracking revenue, bookings, staff performance, and client insights for salon and spa businesses.
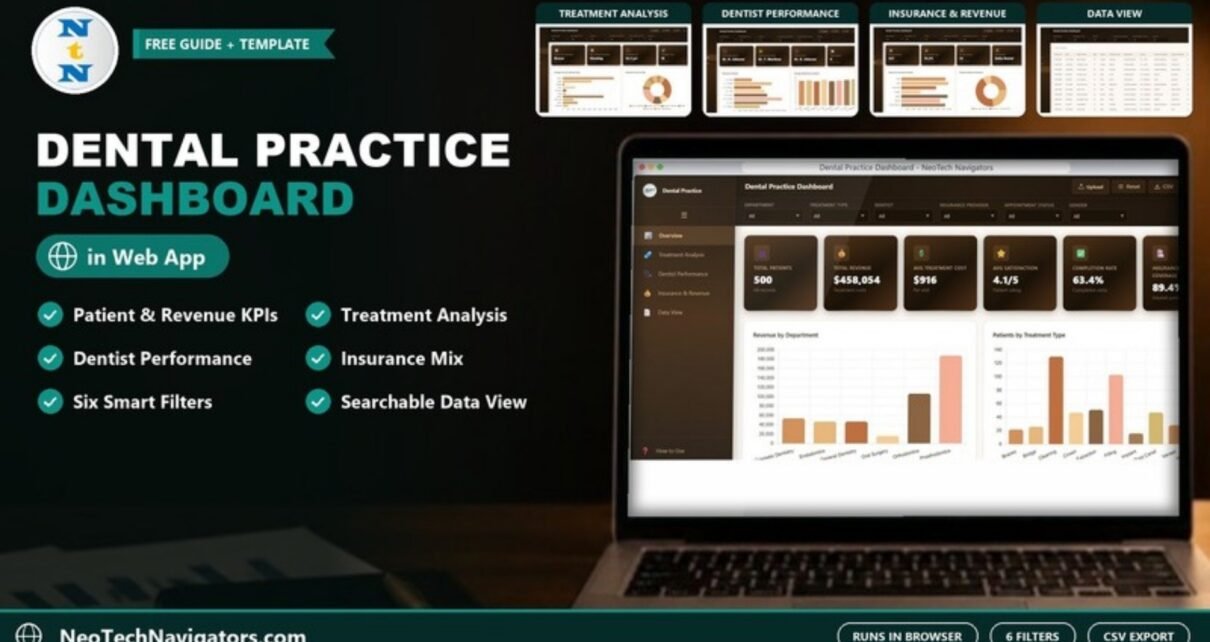
Dental Practice Dashboard in HTML
A page-by-page guide to the Dental Practice Dashboard in HTML: patient, revenue, treatment, dentist and insurance KPIs in a browser-based report, plus how to load your own clinic data.
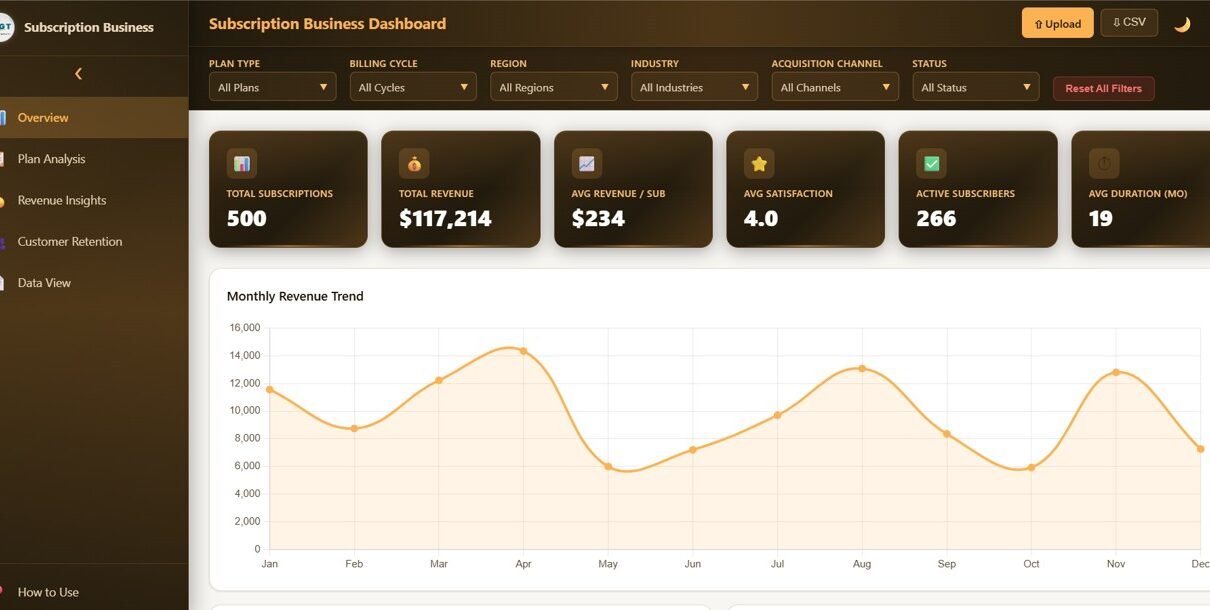
Subscription Business Dashboard in HTML
Subscription Business Dashboard in HTML with 5 interactive pages, 6 KPI cards, and 15+ charts tracking MRR, churn, ARPU, LTV, and growth forecasting in your browser.
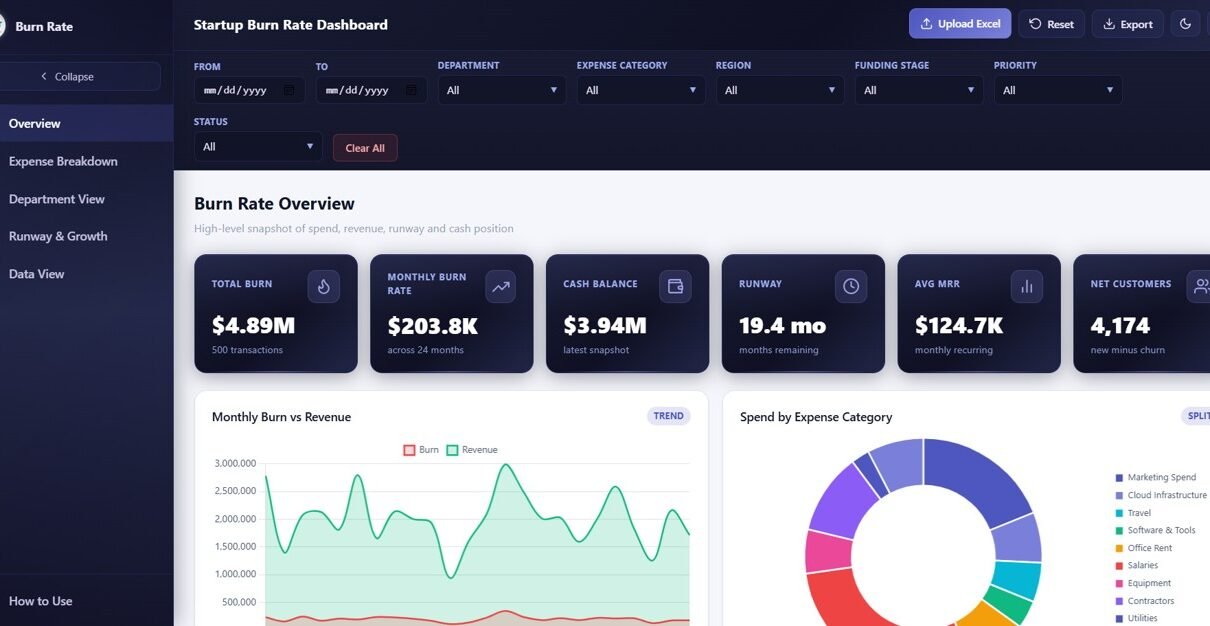
Startup Burn Rate Dashboard in HTML
Track burn rate, runway, MRR, expenses and growth with the Startup Burn Rate Dashboard in HTML. 5 interactive pages, 6 KPIs, 12+ charts running in any browser.
SaaS Financial Model Dashboard in HTML
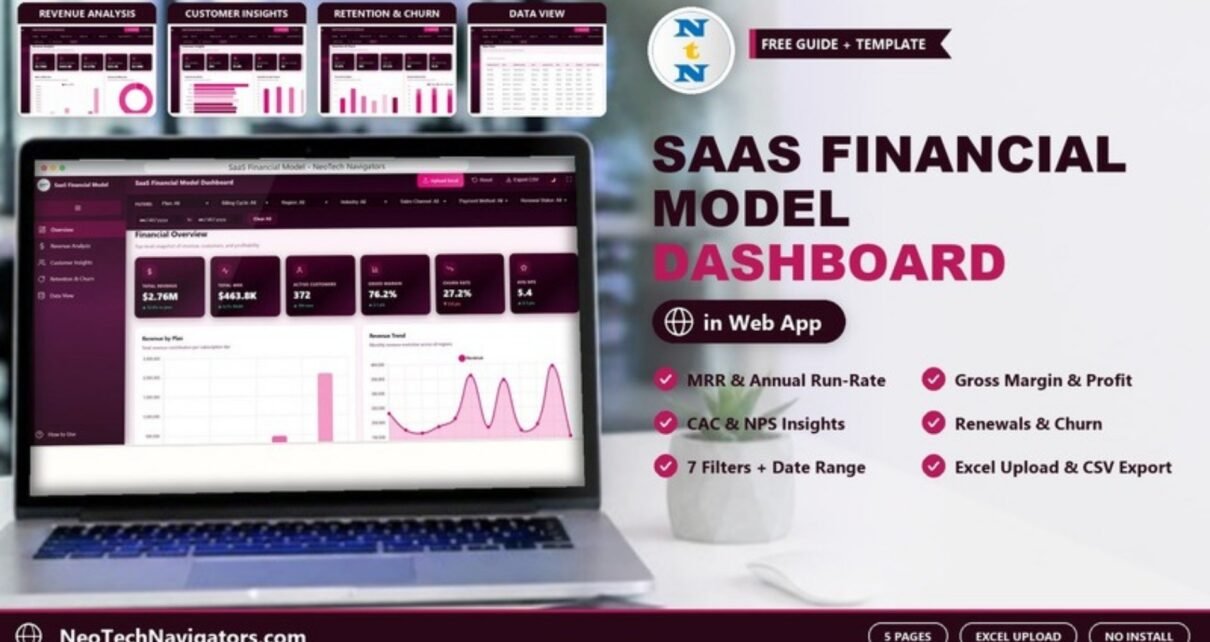
A browser-based SaaS financial dashboard with Overview, Revenue Analysis, Customer Insights, Retention & Churn and Data View pages, tracking revenue, MRR, ARR, gross margin, CAC, NPS, renewals and churn, with Excel upload and CSV export.