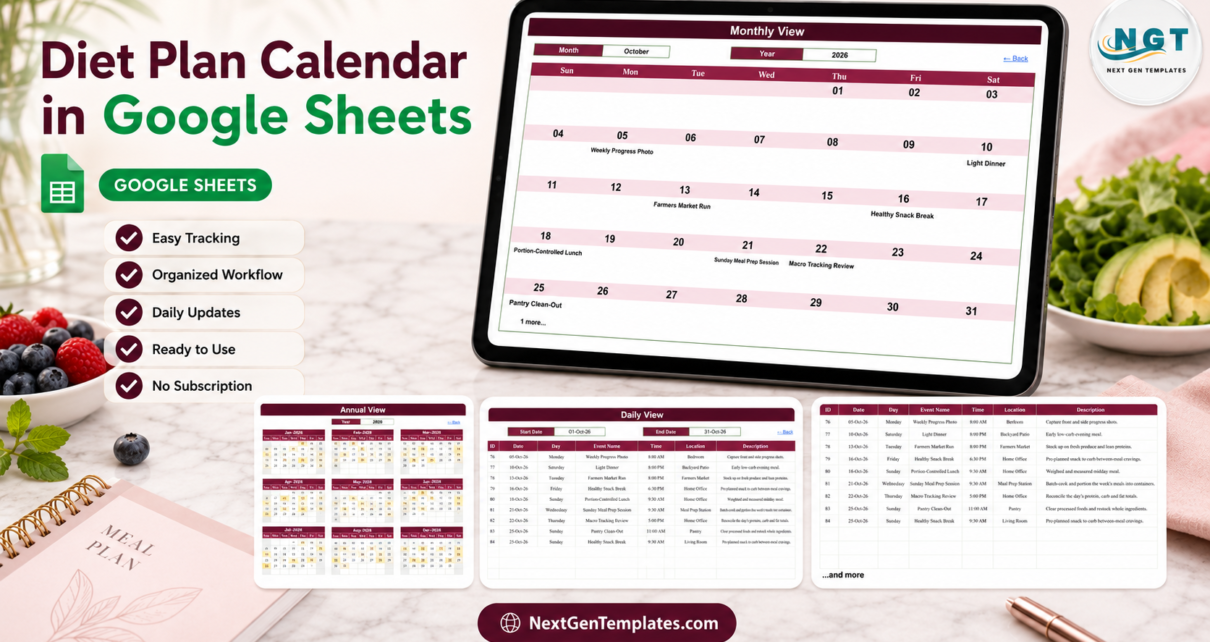
A five-tab Google Sheets calendar that turns one Events table into a year view, a month grid and a printable day list. No macros, no Apps Script, 100 sample rows with every weekday verified. A scheduling calendar only – not medical or nutritional advice.
Blog
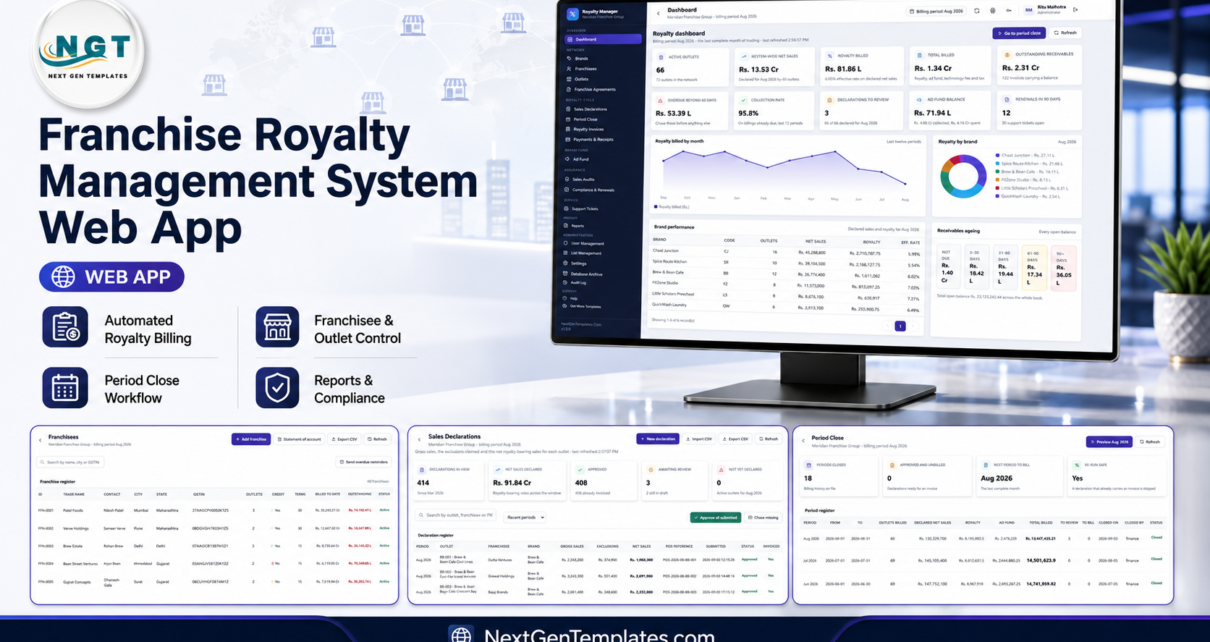
Franchise Royalty Management System Web App
A Google Apps Script web app that bills franchise royalty from each outlet’s own agreement – flat or banded rates with a minimum monthly floor, a one-click period close, receivables ageing, automatic audit back charges and a franchisee self-service portal. Free live demo with all five role logins.
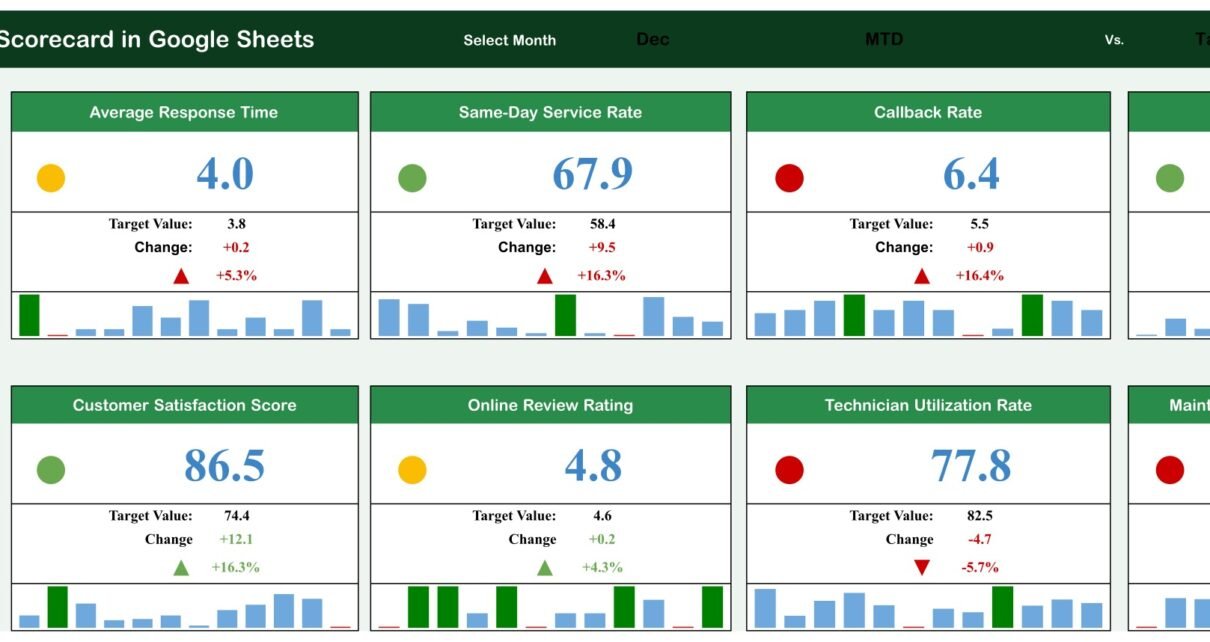
Garage Door Service KPI Scorecard in Google Sheets
Track ten garage door service KPIs on one page in Google Sheets – first-time fix rate, response time, callback rate, margin and utilization – with a month picker, MTD/YTD and Target/PY switches and red-amber-green traffic lights.
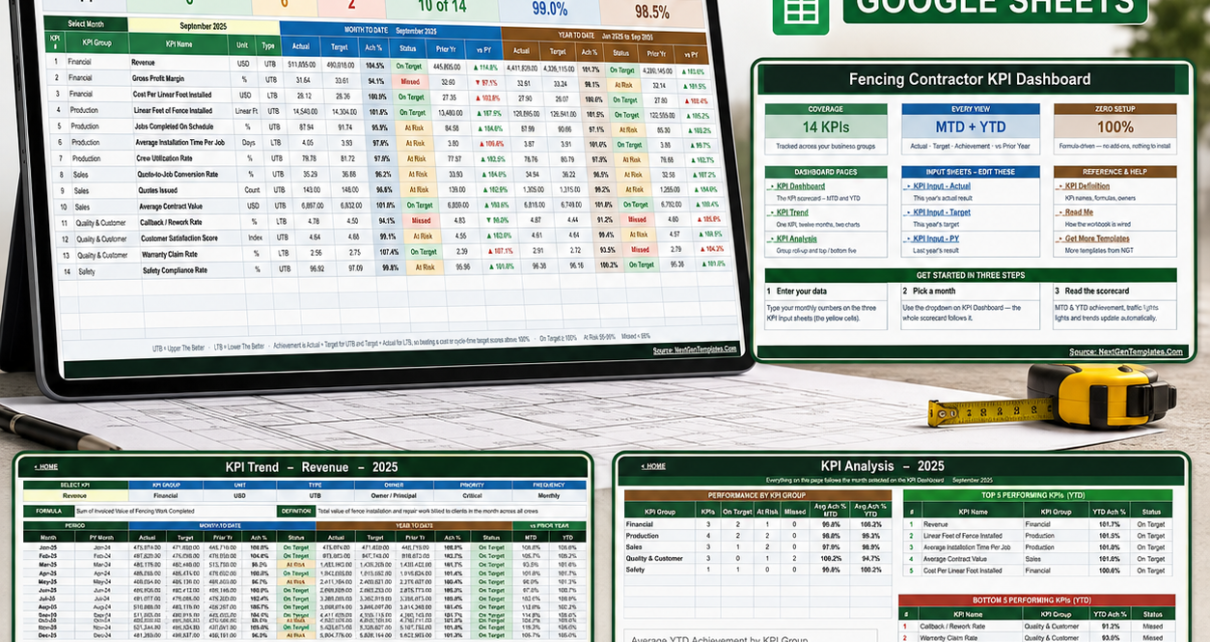
Fencing Contractor KPI Dashboard in Google Sheets
Track 14 fencing contractor KPIs in Google Sheets with MTD and YTD achievement, prior-year comparison, traffic-light status and one month dropdown that drives the whole workbook.
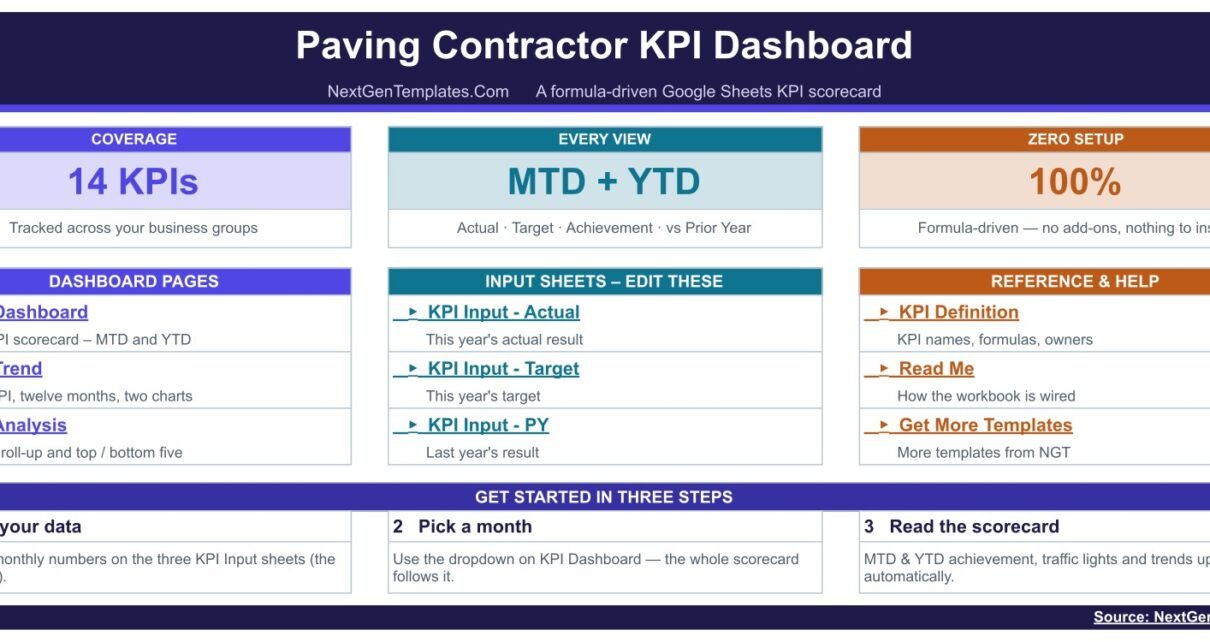
Paving Contractor KPI Dashboard in Google Sheets
A formula-driven Google Sheets KPI dashboard for paving contractors: 14 asphalt-paving KPIs, a month picker, MTD and YTD traffic lights side by side, a twelve-month trend page and a KPI group roll-up.
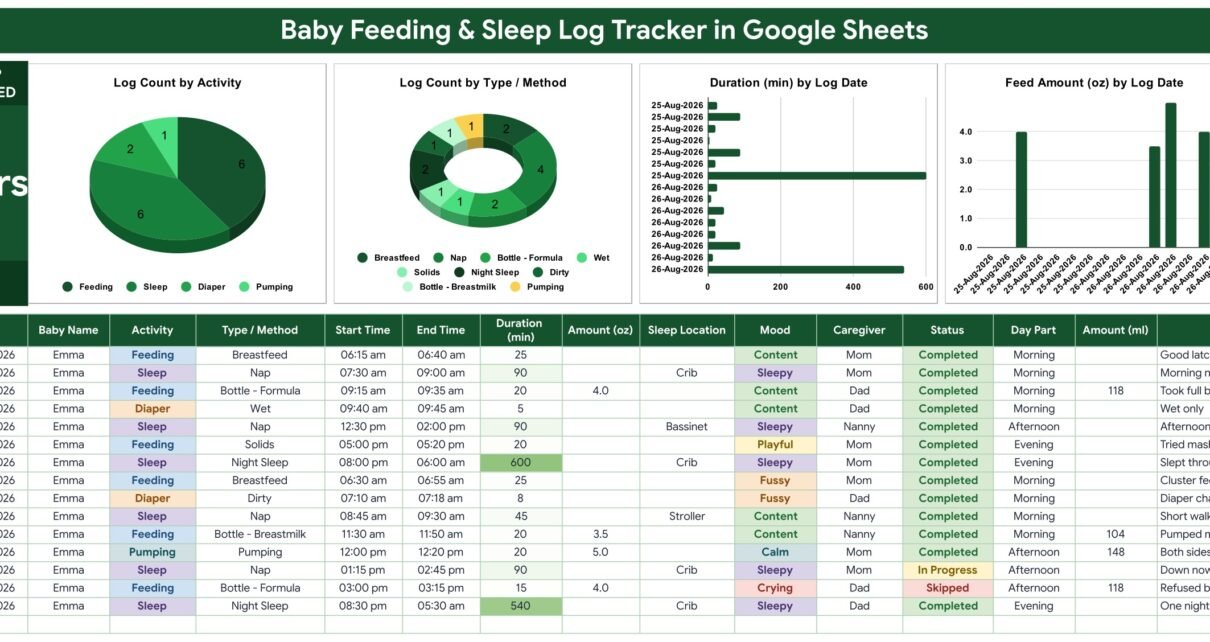
Baby Feeding & Sleep Log Tracker in Google Sheets
Log every feed, nap, night sleep, diaper change and pumping session in one Google Sheet. 16 columns, 4 formula columns, 4 charts and a live Total Sleep Hours Logged card.
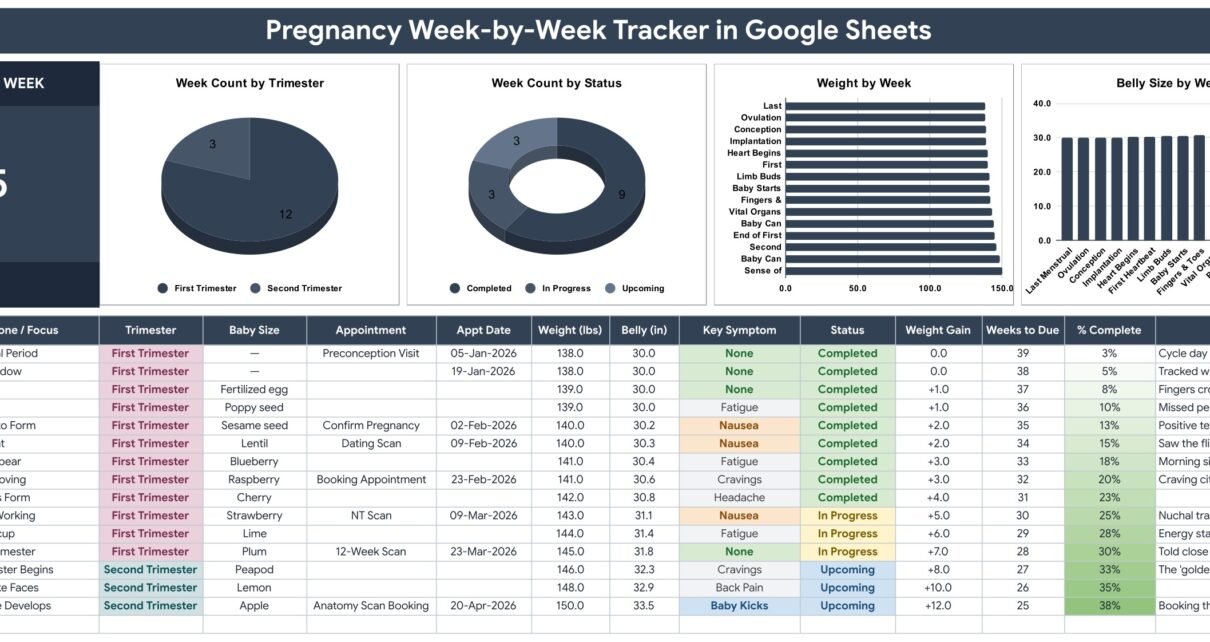
Pregnancy Week-by-Week Tracker in Google Sheets
A one-page Pregnancy Week-by-Week Tracker in Google Sheets: 14 columns, four of them calculated, a Current Week card and four charts. A personal organiser for the 40 weeks – not a medical record and not medical advice.
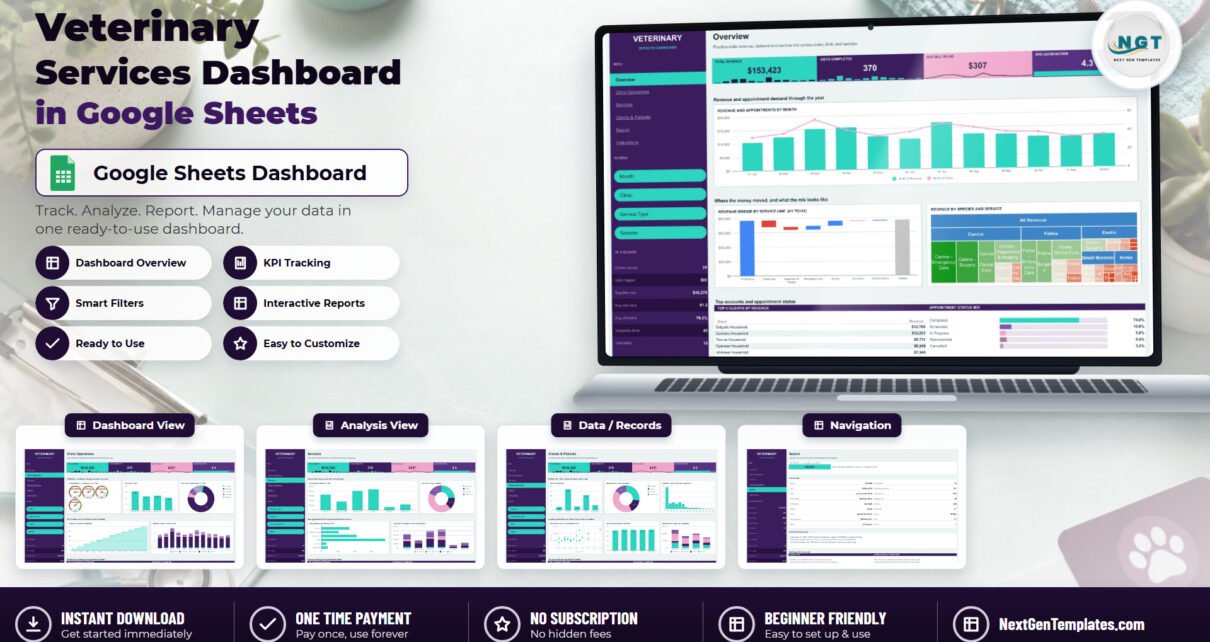
Veterinary Services Dashboard in Google Sheets
A page-by-page walkthrough of the Veterinary Services Dashboard in Google Sheets – seven tabs, 18 pivot-driven charts, 16 slicers and a 500-visit data model for revenue, utilisation and service mix across a practice group.
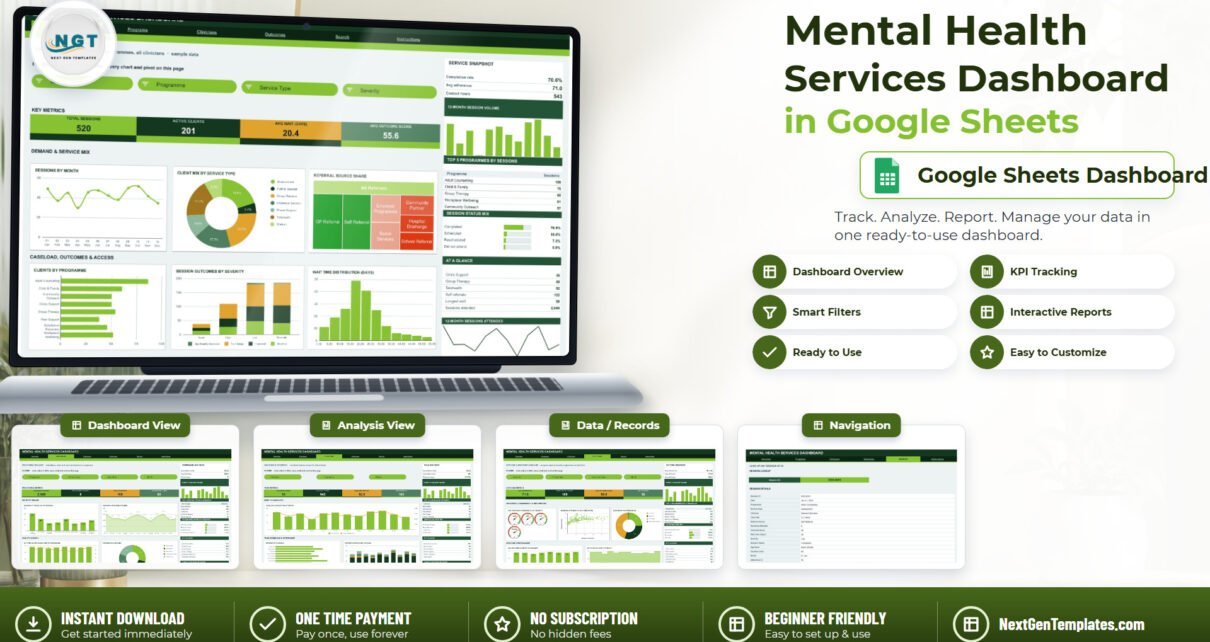
Mental Health Services Dashboard in Google Sheets
A 7-tab Google Sheets reporting template for mental health services: 16 KPI cards, 18 charts, 15 slicers and a 520-row session log. Operations reporting only, not a clinical tool.
Python Matplotlib: Line, Bar and Pie Charts Step by Step
Python Matplotlib is the standard library for charts. With a few lines you can draw line, bar and pie charts from lists or pandas DataFrames, label them, style them and save them as PNG files for reports and slides. This chapter builds each chart type step by step using the sales data from the pandas […]