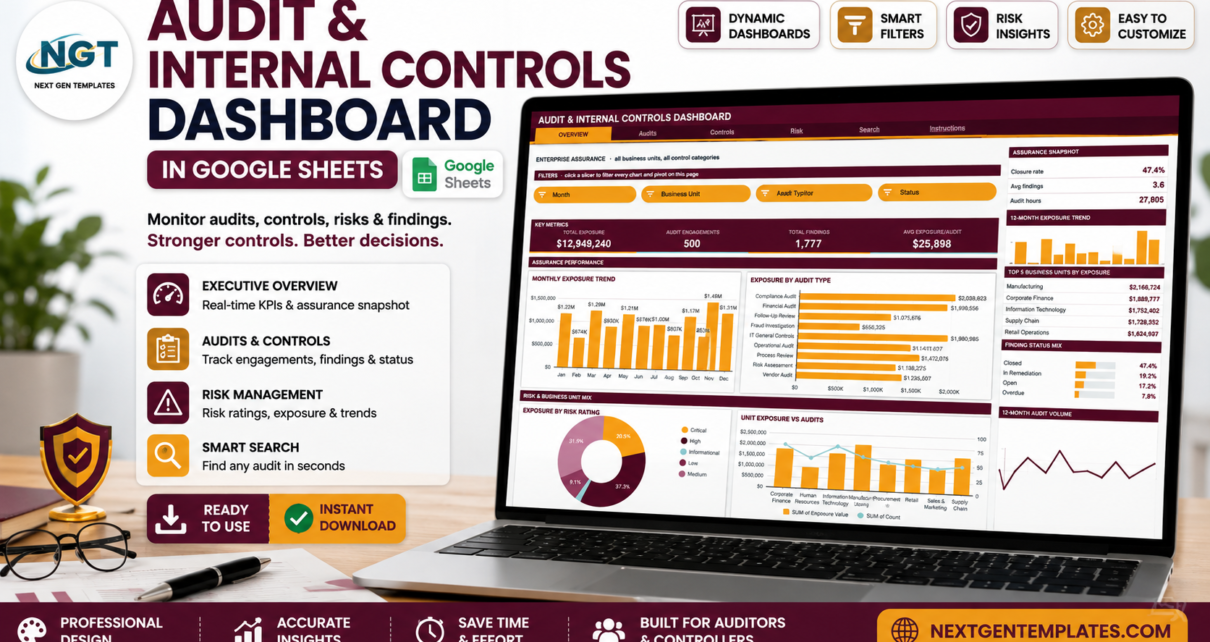
A six-page Google Sheets dashboard for tracking audit engagements, findings, exposure value and control categories – built on native pivot tables and slicers, with 500 sample audits already loaded.
Online Tutorial for Data Analysis and Automation
Google-Sheets-Dashboard
A six-page Google Sheets dashboard for tracking audit engagements, findings, exposure value and control categories – built on native pivot tables and slicers, with 500 sample audits already loaded.
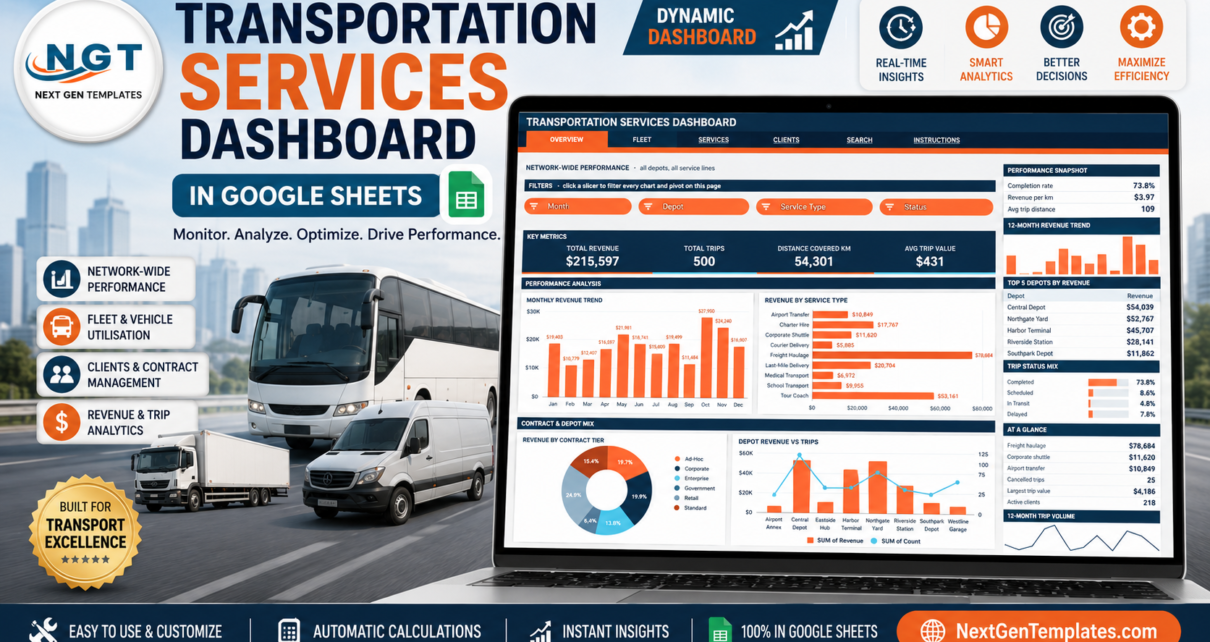
A six-page Google Sheets dashboard for transport operators – 500 sample trips, $215,597 of revenue, 16 slicers and 16 charts built on native pivot tables. Walk through every page, see what it does well, and learn where it stops.
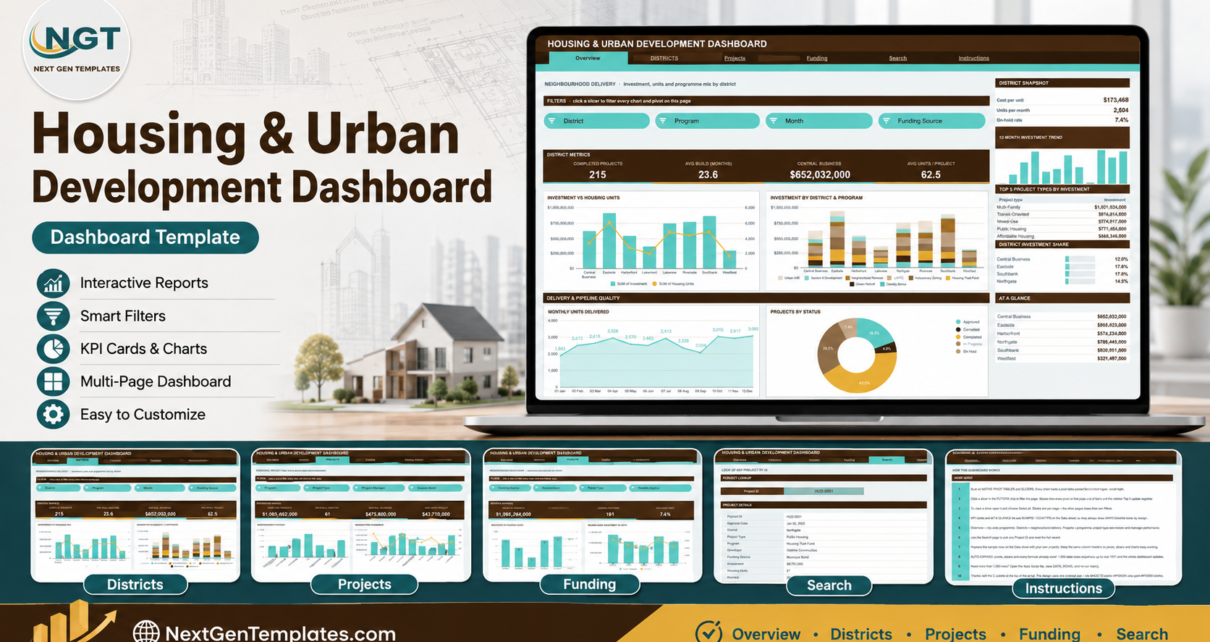
A pivot-and-slicer Google Sheets dashboard for housing programmes: 16 KPI cards, 16 charts and a project lookup across 6 tabs, sized for 1,000 project rows.
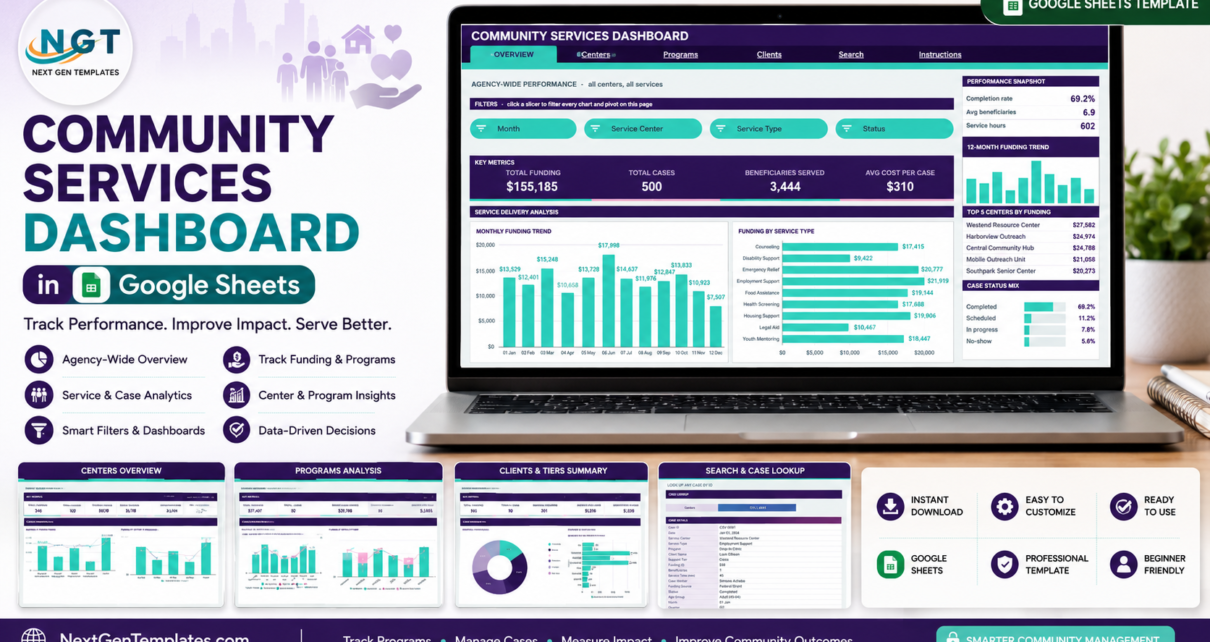
A pivot-and-slicer Community Services Dashboard in Google Sheets that tracks 16 KPIs across Overview, Centers, Programs and Clients pages, plus a Case ID search tab. 500 sample records, 1,000-row capacity, no subscription.
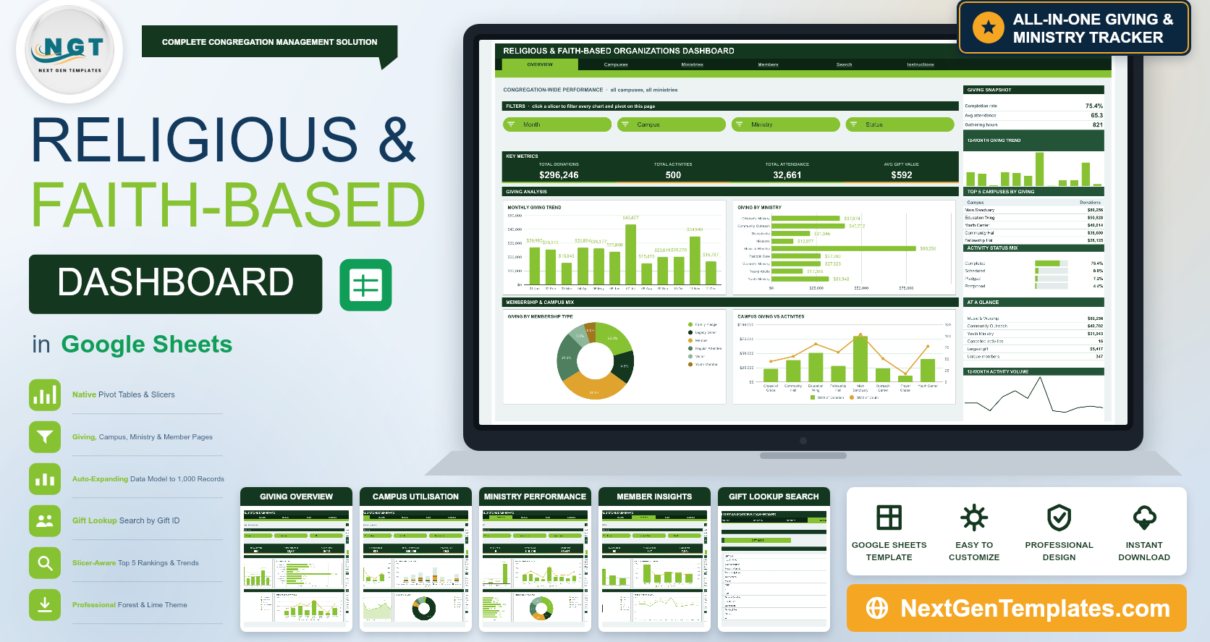
A six-page Google Sheets dashboard for congregations: 16 KPI cards, 16 pivot-driven charts, 16 slicers and a Gift ID lookup covering donations, attendance, campuses, ministries and members across 1,000 rows.
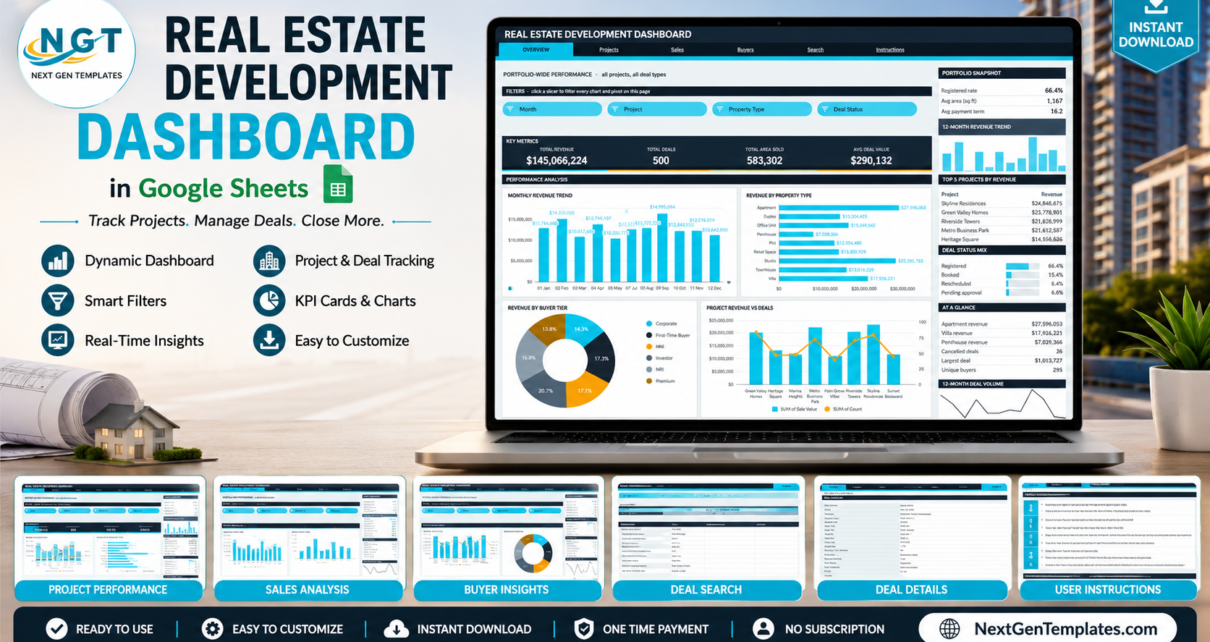
A six-page property development dashboard built on native Google Sheets pivot tables and slicers: 16 KPI cards, 16 charts, revenue per square foot, booking-type and agent analysis, plus a deal lookup page.
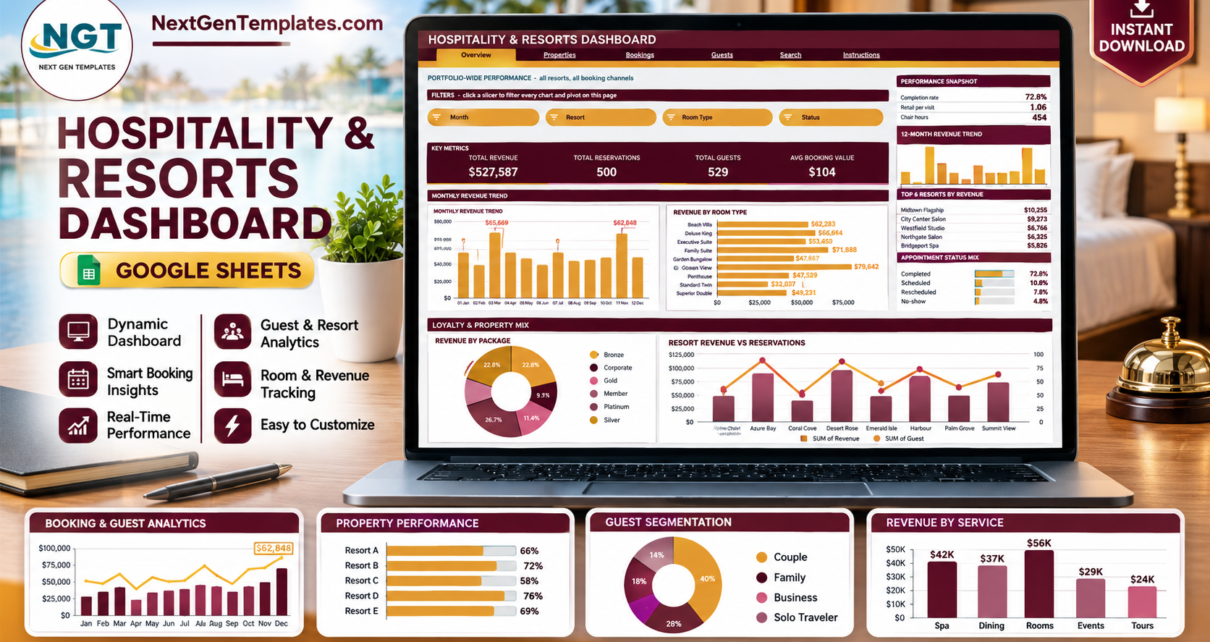
A six-page hotel and resort dashboard built on native Google Sheets pivot tables and slicers: 16 KPI cards, 16 charts, property, package and booking-channel analysis, loyalty tiers, and a reservation lookup page.
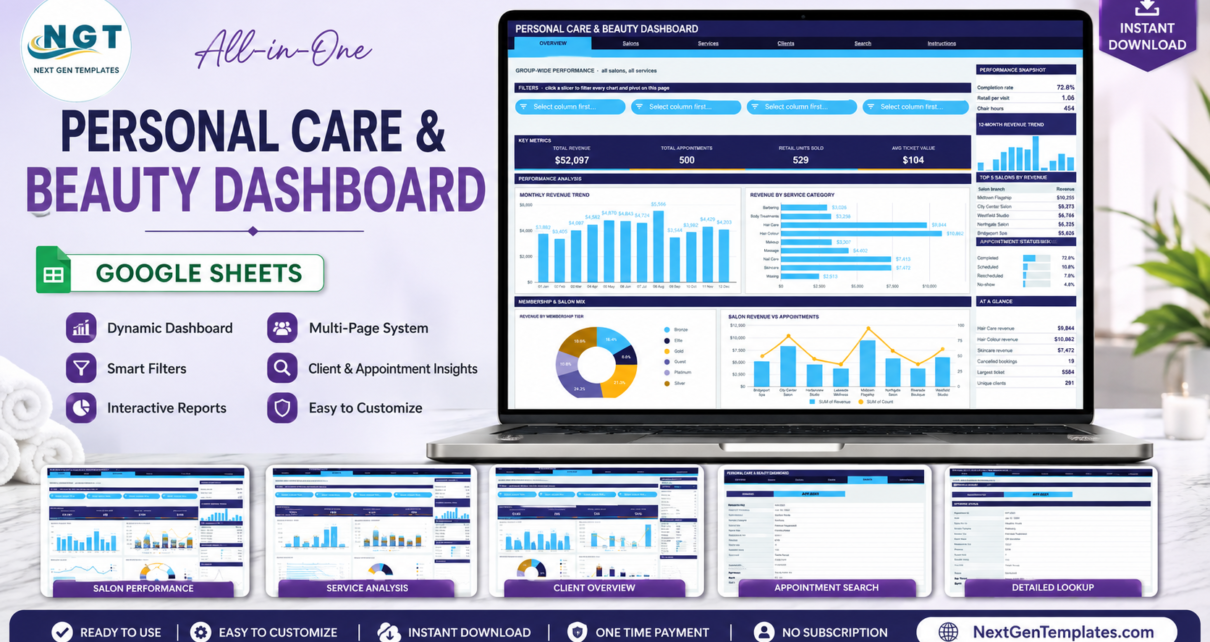
A six-page salon and spa dashboard built on native Google Sheets pivot tables and slicers: 16 KPI cards, 16 charts, branch and specialist analysis, membership and no-show tracking, plus an appointment lookup page.
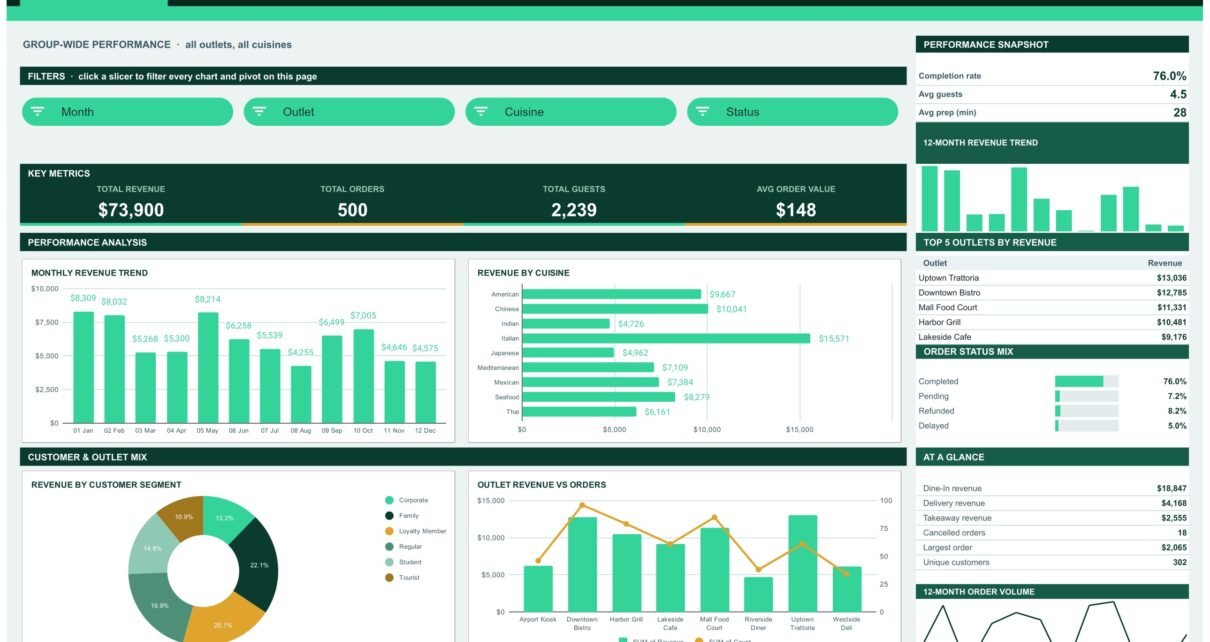
A Google Sheets restaurant dashboard that tracks 16 KPIs across 4 interactive pages using 24 native pivot tables, 16 charts and 16 slicers. Compare outlets, cuisines, channels and customer segments without a POS subscription.
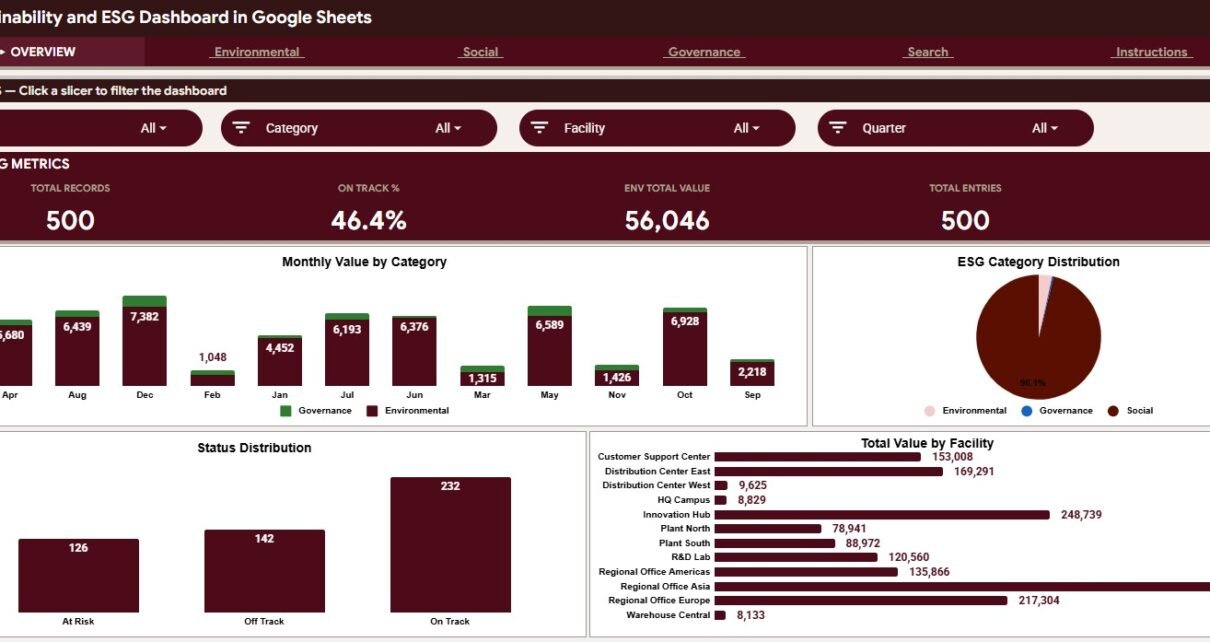
Track environmental, social, and governance records in Google Sheets with overview cards, ESG charts, slicers, search lookup, data sheet tabs, and targets.