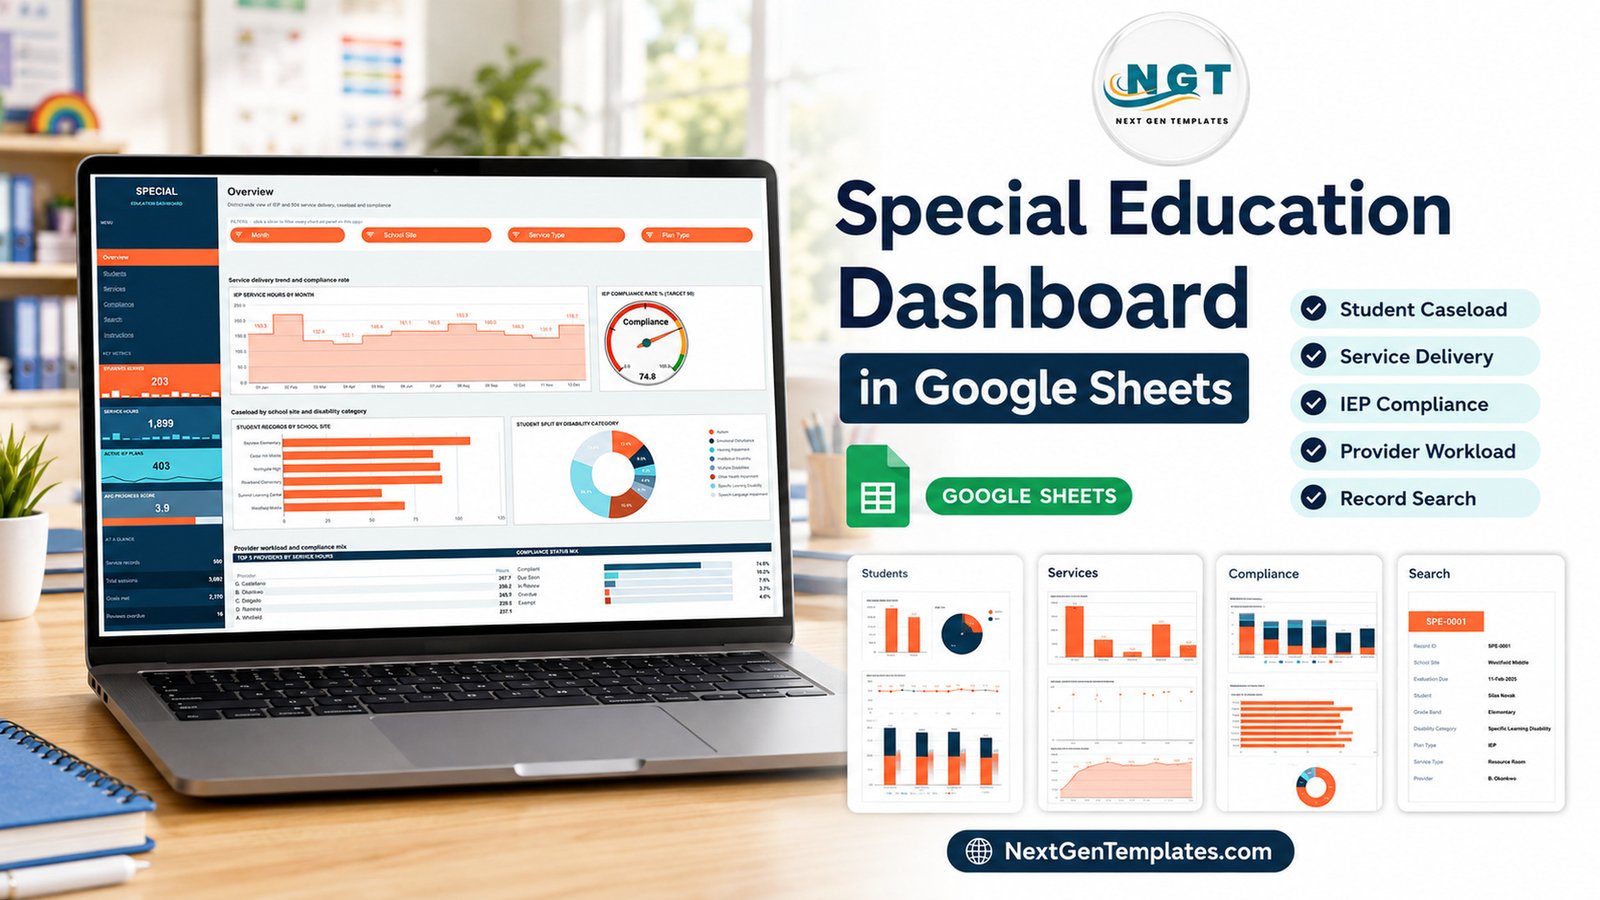
The Special Education Dashboard in Google Sheets is an administrative tracking template built on 6 linked pages, 16 charts, 15 slicers and 8 headline metrics. It ships with 500 demo service records, and every pivot and lookup formula is pre-wired to 1,000 rows, so the whole file redraws itself the moment you paste your own administrative data in.
Special-education programme administration generates a lot of routine counting: how many students are on the caseload, how many service hours each provider delivered, which internal reviews are coming up. Most small teams do that counting in three or four unconnected spreadsheets and re-do it every month. This template puts the counting in one place, keeps it filterable, and leaves the actual student records exactly where they already live.
Get the Special Education Dashboard in Google Sheets
⚠️ Read this first — what this template is and is not.
This is a spreadsheet template for administrative tracking only. It is not an IEP system, not a special-education case-management system, not a student information system and not a compliance tool.
It does not make you or your district compliant with IDEA, Section 504, FERPA, ADA, GDPR or any other state or national special-education regulation, and it produces no legally valid IEP, 504 plan, evaluation, eligibility determination or progress report.
It gives no clinical, educational, diagnostic, therapeutic or placement advice, and it has no assessment or screening capability. Every figure and name shipped in the file is demo data, not a real student.
Data protection is your responsibility. If you enter real student names or disability information you are handling sensitive personal data about minors, and securing, retaining and sharing it lawfully is entirely down to you and your organisation. The official guidance from the U.S. Department of Education IDEA site is the place to start, not a spreadsheet.
Key Features of the Special Education Dashboard in Google Sheets
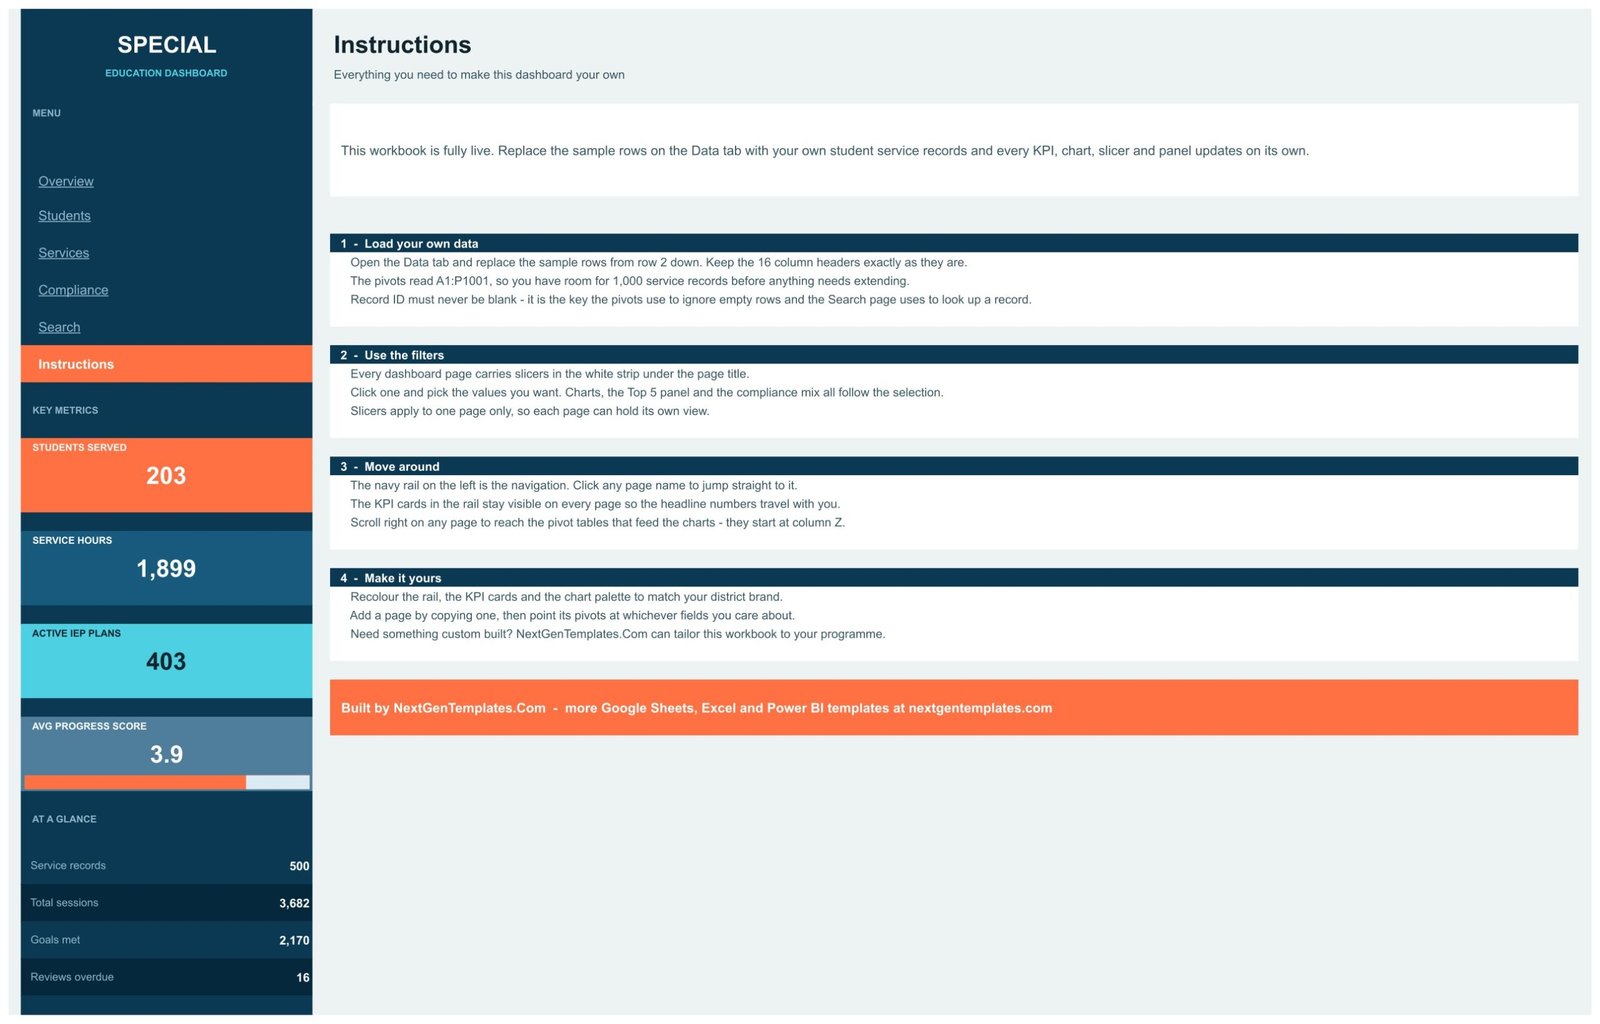
Six pages sit behind one navy navigation rail — Overview, Students, Services, Compliance, Search and Instructions. Click a page name in the rail and you land there. The four KPI cards in the rail stay visible on every page, so the headline numbers travel with you.
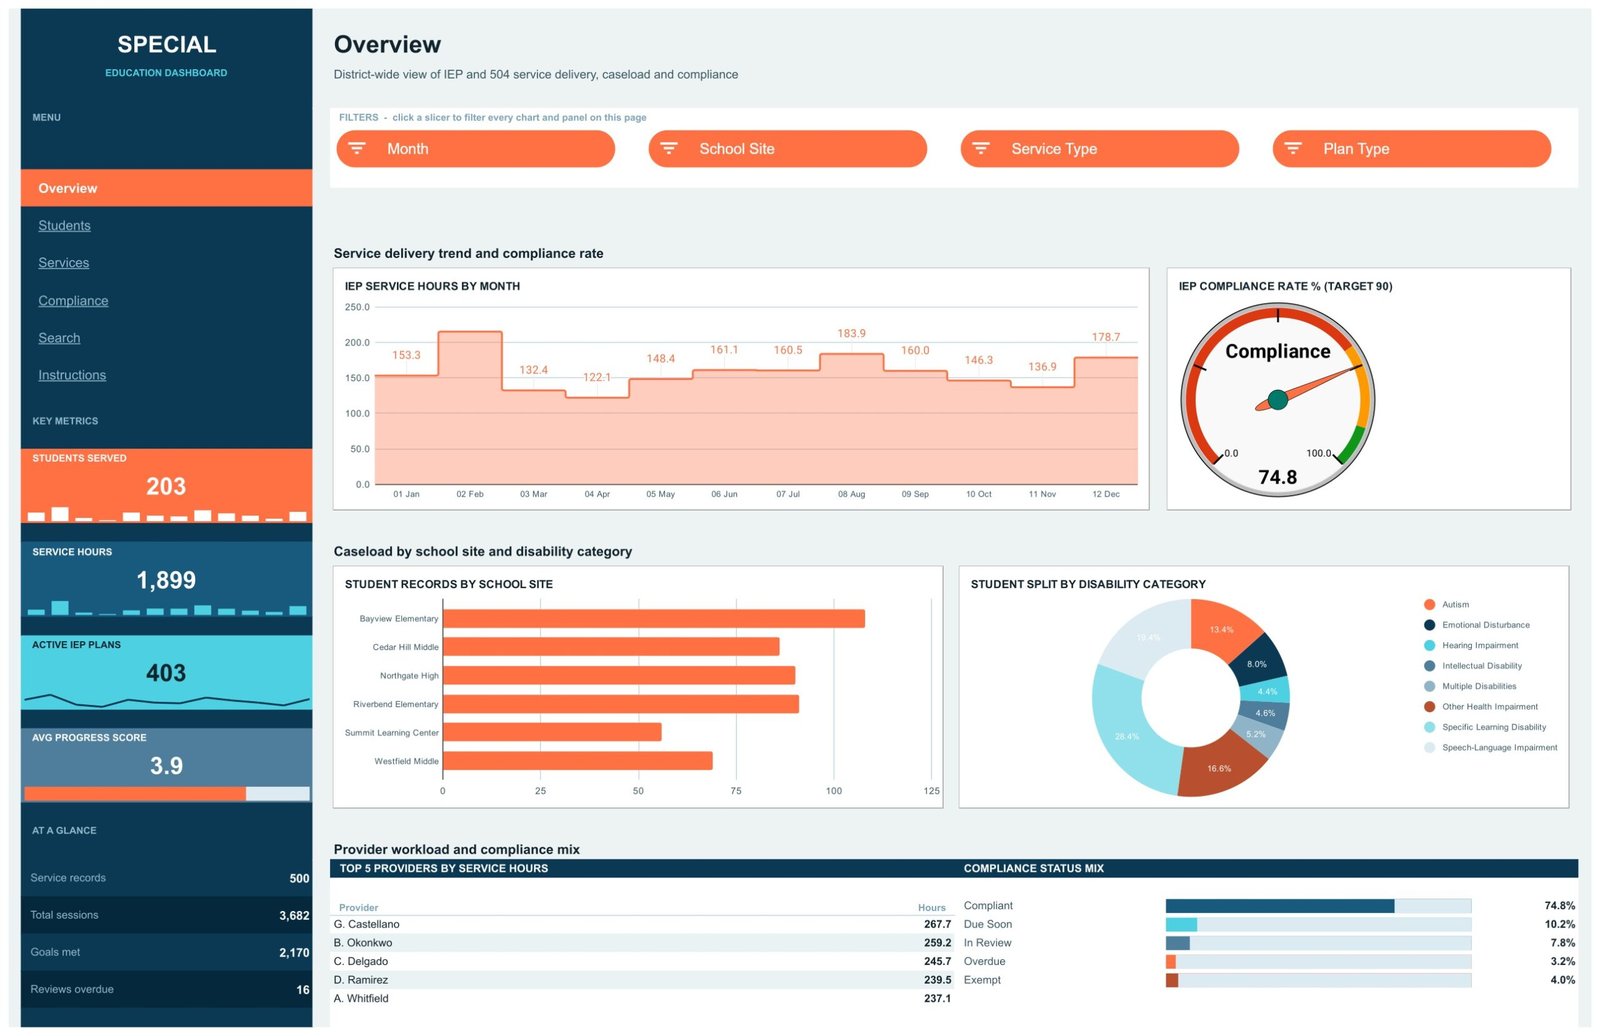
- 8 metrics computed live. Students Served, Service Hours, Active IEP Plans and Avg Progress Score appear as large cards with sparklines, backed by an “At a glance” block carrying Service records, Total sessions, Goals met and Reviews overdue. The demo file reads 203, 1,899, 403, 3.9, 500, 3,682, 2,170 and 16.
- 16 charts, already built. Stepped area, gauge, bar, column, stacked column, donut and scatter charts all point at pivot tables that begin at column Z. You never build a chart yourself.
- 15 slicers, scoped per page. Month, School Site, Service Type, Plan Type, Grade Band, Disability Category, Provider and Compliance Status. Because slicers apply to one page only, four people can hold four different views of the same file at once.
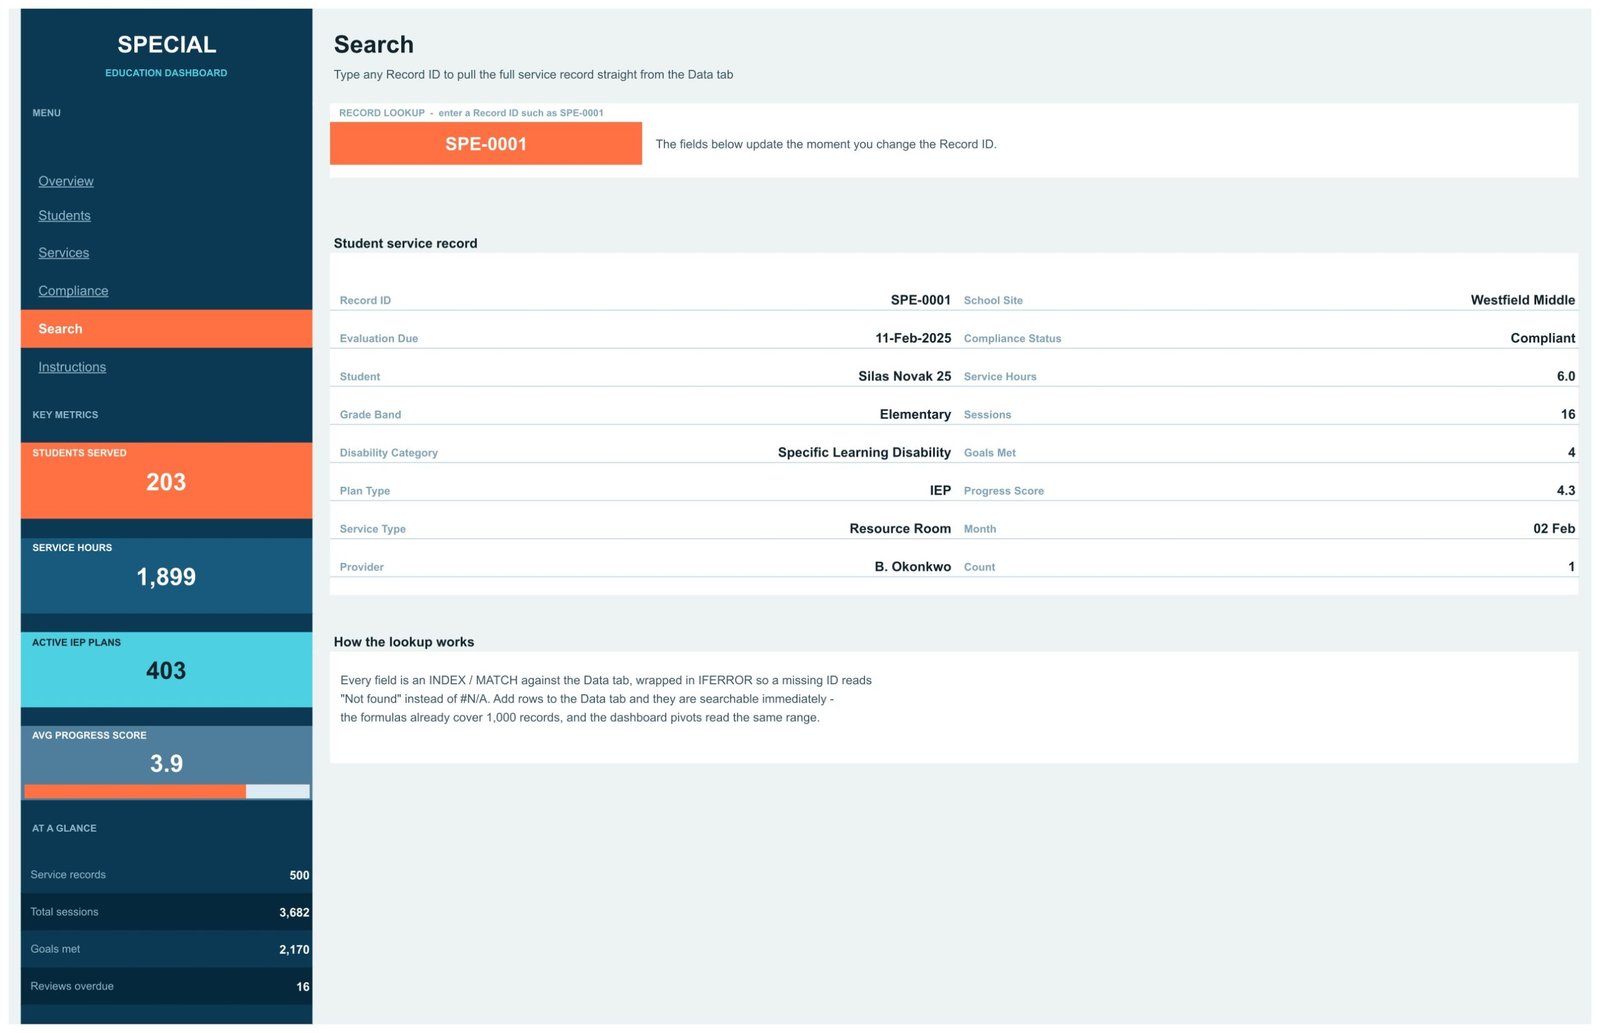
- A Record ID lookup. Type an ID such as SPE-0001 and 16 fields populate through INDEX / MATCH wrapped in IFERROR, so a bad ID reads “Not found” rather than throwing #N/A across the page.
- Room for 1,000 records. The pivots and every Search formula read A1:P1001. The demo file uses 500 of those rows.
- Nothing to install. No add-ons, no Apps Script, no macros. It is a plain Google Sheets file that shares with a link and opens in the mobile app.
Dashboard Pages Explanation
Page 1: Overview
A district-wide view of service delivery, caseload and internal review status, filtered by Month, School Site, Service Type and Plan Type. The charts are IEP Service Hours by Month, IEP Compliance Rate % (Target 90) drawn on a gauge, Student Records by School Site and Student Split by Disability Category. Below them sit a Top 5 Providers by Service Hours table and a Compliance Status Mix panel.
Page 2: Students
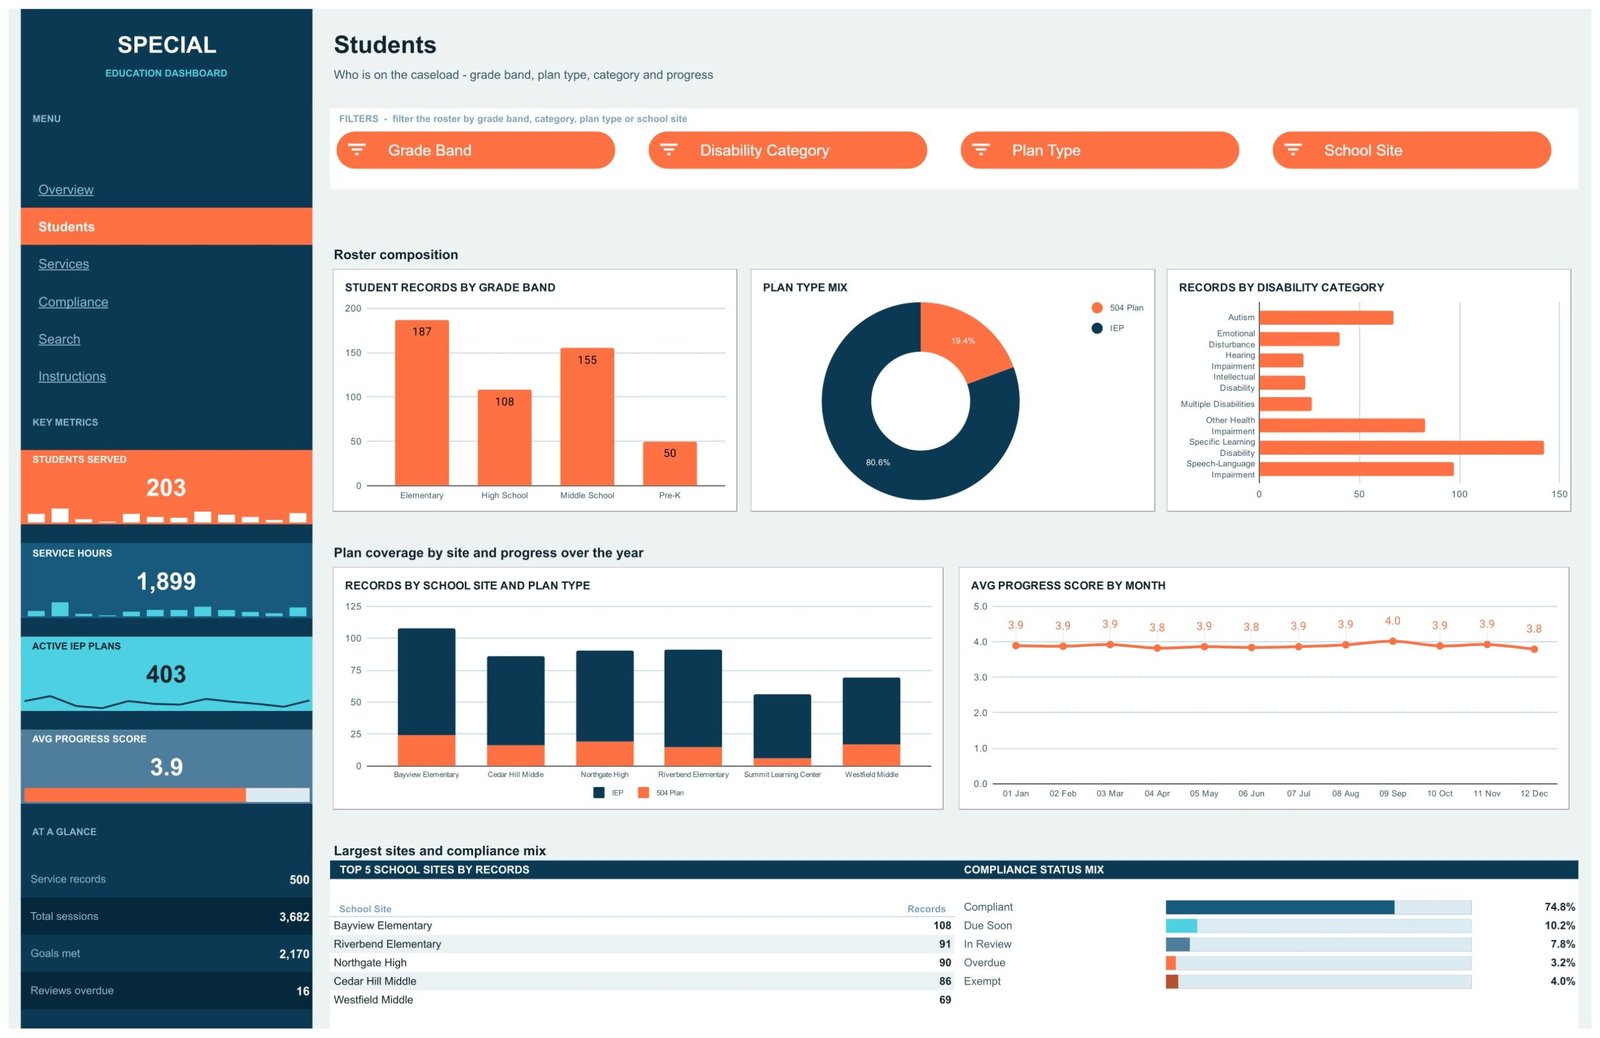
Who is on the caseload, by grade band, plan type, category and progress. Slicers are Grade Band, Disability Category, Plan Type and School Site. Charts include Student Records by Grade Band, Plan Type Mix, Records by Disability Category, Records by School Site and Plan Type, and Avg Progress Score by Month, with a Top 5 School Sites by Records table underneath.
Page 3: Services
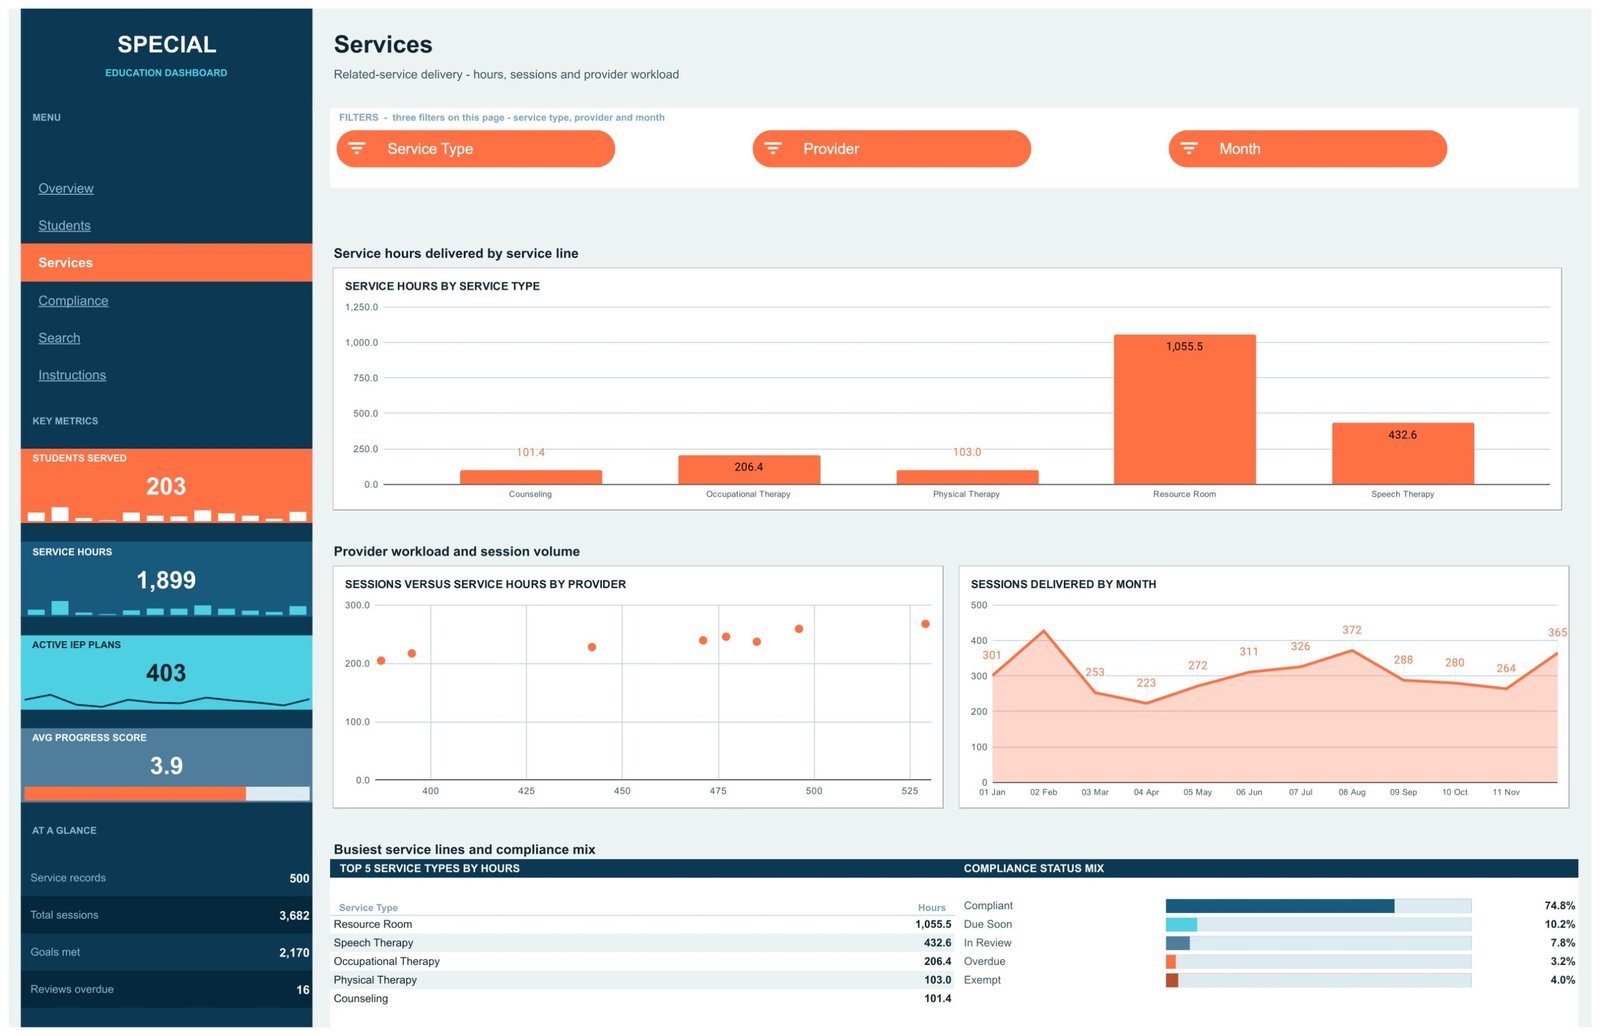
Related-service delivery — hours, sessions and provider workload — filtered by Service Type, Provider and Month. Charts are Service Hours by Service Type, Sessions versus Service Hours by Provider and Sessions Delivered by Month, with a Top 5 Service Types by Hours table beneath. This is the page that shows you, in one glance, which service line is absorbing most of the year.
Page 4: Compliance
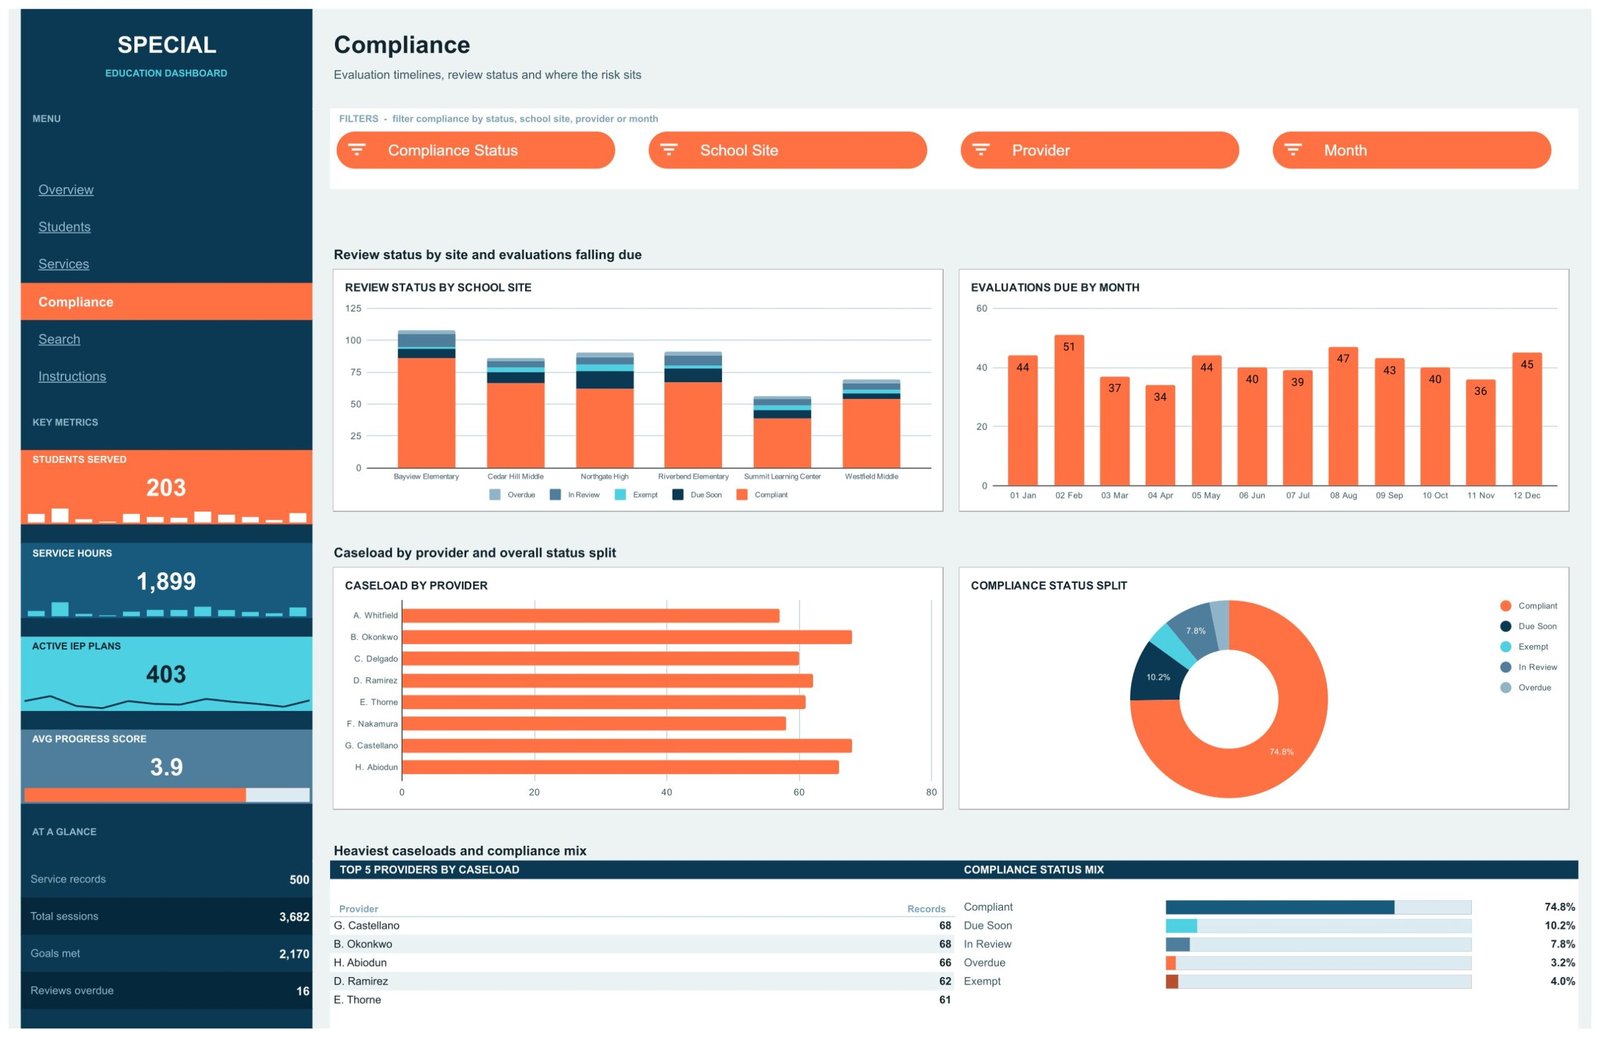
Internal review timelines and where the administrative backlog sits, filtered by Compliance Status, School Site, Provider and Month. Charts are Review Status by School Site, Evaluations Due by Month, Caseload by Provider and Compliance Status Split, with a Top 5 Providers by Caseload table. Everything on this page reflects the dates and statuses you typed in yourself — it is a workload view, not a regulatory determination.
Page 5: Search
A single-record lookup. Enter a Record ID and the page returns School Site, Evaluation Due, Grade Band, Plan Type, Service Type, Provider, Service Hours, Sessions, Goals Met, Progress Score, Month and Compliance Status for that one row. The record visible in the screenshot is fictional demo data shipped with the template.
Page 6: Instructions
Four short setup steps: load your own data, use the filters, move around, and make it yours. It tells you exactly which ranges the pivots read and where the pivot tables start, so extending the file later is a five-minute job rather than an archaeology exercise.
Special Education Dashboard vs. Excel Dashboard vs. Paid Special-Programs SaaS — Feature Comparison
| Feature | Special Education Dashboard in Google Sheets | Microsoft Excel Dashboard | Frontline IEP / PowerSchool Special Programs |
|---|---|---|---|
| Cost | $9.99 one-time ✅ | $13.99 to $19.99 one-time | Quoted per district, typically thousands per year |
| Platform | Google Sheets, browser only ✅ | Microsoft Excel desktop | Hosted web platform |
| Setup time | Under 10 minutes ✅ | Under 15 minutes | Weeks of onboarding and data migration |
| Real-time team collaboration | Yes, native multi-user editing ✅ | Only via OneDrive co-authoring | Yes |
| Mobile access | Google Sheets mobile app ✅ | Excel mobile, limited slicer support | Yes |
| Customisable fields and colours | Fully editable, 16 columns ✅ | Fully editable | Vendor-configured |
| Share with a link | Yes ✅ | File attachment or OneDrive link | Account-based access |
| Year-1 cost at 5 users | $9.99 total ✅ | $13.99 to $19.99 total | Four to five figures |
| Generates legal IEP or 504 documents | No | No | Yes ✅ |
| Statutory compliance workflow and audit trail | No | No | Yes ✅ |
The last two rows matter more than the price row. A special-programs platform does statutory work this spreadsheet deliberately does not attempt. For a coordinator who needs caseload, service hours and internal review dates in one filterable view, and who keeps the legal record in the system built for it, the Special Education Dashboard in Google Sheets sits in the sweet spot.
Who Should Use This Template
Perfect for:
- Special-education coordinators and programme administrators whose caseload counts currently live in several unlinked spreadsheets
- Small districts, single schools and independent providers who want one administrative view of service hours and provider workload
- Therapy and related-service practices reporting on session counts for their own staffing and invoicing
- Anyone who wants a lightweight Google Sheets reporting layer beside an existing system of record
Not a fit if:
- You need to author, sign or store IEPs, 504 plans, evaluations or eligibility determinations
- You are looking for a compliance guarantee under IDEA, Section 504, FERPA, ADA or GDPR — this template offers none
- You expect clinical, diagnostic, therapeutic or placement guidance — there is no such capability in the file
- Your district requires SOC 2, single sign-on, role-based permissions or an audit trail on student records
- You want to store identifiable student data without first doing your own data-protection assessment
Real-World Use Cases
Dana coordinates related services across six school sites. Each Monday she pastes the week’s session log into the Data tab, opens the Services page and reads Service Hours by Service Type and Sessions versus Service Hours by Provider. Two minutes tells her whether one provider is carrying an unbalanced load, months before the pattern would have shown up in a year-end report.
Marcus runs a four-therapist private practice. He uses the Students and Services pages purely to summarise sessions delivered by month for staffing and invoicing. Identifiable client records never enter the sheet — they stay in his practice-management software, and the sheet holds internal codes only.
Priya administers a single independent school. She uses the Compliance page to see which internal reviews her team has logged as due soon, prints the Top 5 Providers by Caseload panel for a staffing conversation, and takes the resulting list into the systems where the actual documents live.
Advantages of the Special Education Dashboard
The clearest advantage is cost shape. A one-time $9.99 purchase replaces nothing legally, but it replaces several hours of monthly manual counting, and it does so without adding a per-user subscription line to a budget that rarely has room for one. A team of five uses the same file at the same time for the same price as one person.
The second advantage is that it is ordinary Google Sheets. There is no vendor lock-in, no add-on to authorise, nothing to renew. If your data outgrows the shipped 1,000-row range you extend the range yourself, exactly as you would in any other sheet. Google’s own documentation on pivot tables covers everything you would need.
The third is honesty of scope. Because the file does not pretend to be a case-management system, nobody on your team can mistake it for one, and the boundary between “our reporting view” and “our official record” stays clean.
Opportunities for Improvement
There are real limits worth stating. The template holds one flat table — there is no relational link between a student and multiple plan years, so longitudinal history has to be modelled as extra rows. It has no permissions model beyond whatever Google Sheets sharing gives you, which is a genuine problem if you intend to store identifiable data. The 1,000-row ceiling is comfortable for a small programme and tight for a large district. And the gauge chart on the Overview page is decorative rather than analytical; the Compliance Status Split donut carries the same information more precisely.
None of these are defects so much as consequences of it being a spreadsheet. They are the reason the “Not a fit if” list above is as long as it is.
Best Practices
- Decide your data policy before your first paste. Initials or internal record codes will serve almost every reporting purpose that full names would, at a fraction of the risk.
- Never leave Record ID blank. It is the key the pivots use to ignore empty rows and the Search page uses for lookups.
- Keep the 16 headers untouched. Rename a header and the pivots lose their field.
- Use one page per question. Slicers are page-scoped, so leave the Overview unfiltered as your standing summary and filter the analysis pages instead.
- Re-check the shared link’s permissions each term. A file shared once tends to stay shared.
Explore Relevant Templates
The same subject is available on two other platforms: the Special Education Dashboard in Excel and the Special Education Dashboard in Power BI. If you want a month-picker scorecard instead of an analytical dashboard, the Special Education KPI Dashboard in Excel is a different template despite the similar name.
For neighbouring school reporting we have written up the Primary Schools Dashboard in Google Sheets, the Secondary Schools Dashboard in Google Sheets and the Colleges & Universities Dashboard in Google Sheets. Teams running tuition or training programmes usually prefer the Coaching & Tutoring Dashboard in Google Sheets, the Vocational Training Dashboard in Google Sheets or the Language Schools Dashboard in Google Sheets.
Want to build skills like this step by step? The Excel Pivot Tables & Dashboards course on NextGenTemplates Academy walks you through it with practice files.
Get the Special Education Dashboard in Google Sheets
Frequently Asked Questions
Does this make our district compliant with IDEA or FERPA?
No. The Special Education Dashboard in Google Sheets is an administrative tracking spreadsheet. It confers no compliance with IDEA, Section 504, FERPA, ADA, GDPR or any other regulation, and it produces no legally valid IEP, 504 plan, evaluation or progress report. Your official system of record stays exactly where it is.
Is this an IEP or case-management system?
No. It does not author, store or sign IEPs, 504 plans or evaluations, and it is not a student information system. It reads a flat table of administrative records that you maintain yourself and charts the totals. Nothing in it replaces a special-programs platform.
Can I enter real student names?
Technically yes, but that is your decision and your responsibility. Names and disability information are sensitive personal data about minors. Assess your legal position first and consider initials or internal record codes instead. Every sample row shipped in the template is demo data, not a real child.
What does the template actually track?
Sixteen columns of administrative data summarised into eight metrics and 16 charts: students served, service hours, active plan counts, sessions, goals met, progress scores, provider caseload and the internal review status you record yourself. It performs no assessment or scoring of its own.
How long does setup take?
Under 10 minutes. Open the PDF in your download, click the “Make a copy” link, paste your rows into the Data tab from row 2 down and leave the headers alone. Every KPI card, chart, slicer and panel updates on its own.
How many records can it hold?
The pivots and lookup formulas read A1:P1001, giving room for 1,000 service records before anything needs extending. The demo file ships with 500 rows. Widening those ranges is an ordinary Google Sheets edit if your programme outgrows them.
How does this compare with a paid special-programs platform?
It costs $9.99 once rather than a recurring district licence, and it sets up in minutes instead of weeks. In exchange it does none of the statutory work: no document generation, no audit trail, no permissions model. It is a reporting layer, not a replacement.
About the Author
Built by PK — Microsoft Certified Professional with 15+ years of Excel, Google Sheets and Power BI experience. Founder of NextGenTemplates, reaching 300K+ subscribers across YouTube channels. Every template is hand-built and tested before release.
Conclusion
If your special-education programme administration currently means rebuilding the same counts every month, the Special Education Dashboard in Google Sheets turns that into a paste and a glance. Just be clear about what you are buying: a reporting layer for administrative data, with explicit non-claims about compliance, clinical judgement and legal documentation, and with the responsibility for any real student data resting entirely with you.
Instant download · One-time payment · No subscription
Last updated: September 2026