A browser-based trucking and logistics dashboard with 5 interactive pages, 6 KPI cards, and 13 dynamic charts for shipments, revenue, fuel cost, on-time rate, drivers, and fleet profitability. Runs offline in any browser — one-time $12.99 purchase, no subscription, no login.
HTML Dashboard
HTML Dashboard
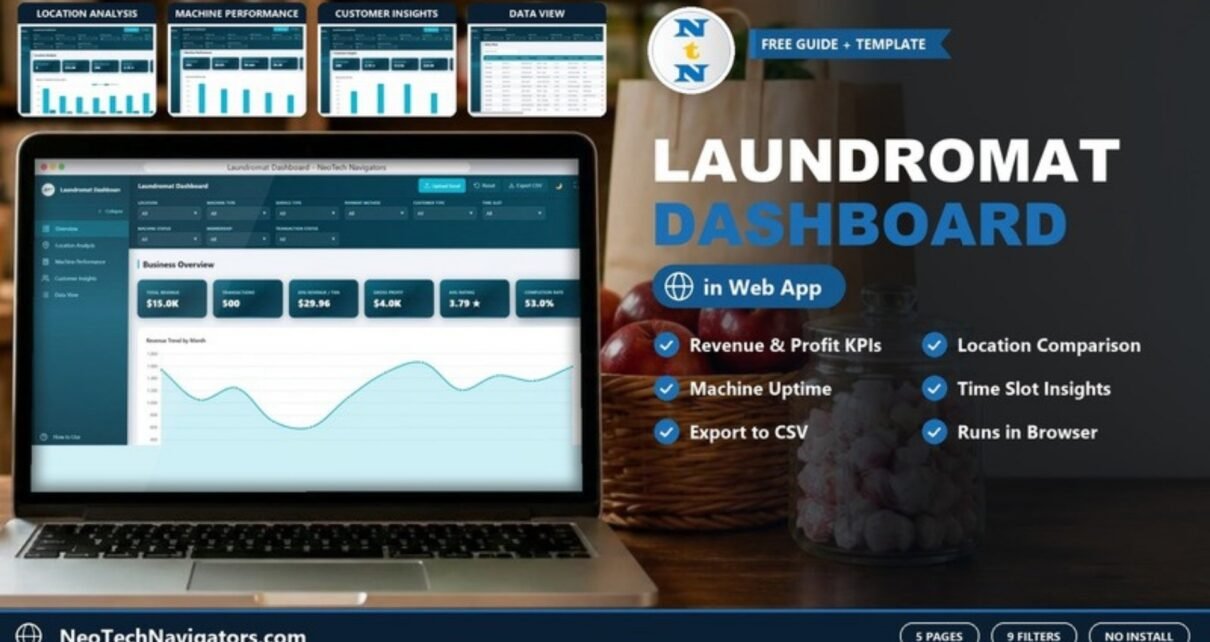
Laundromat Dashboard in HTML
A browser-based laundromat dashboard with five pages for revenue, location costs, machine performance, customer insights and transaction data. See what each page shows and how to load your own POS data.
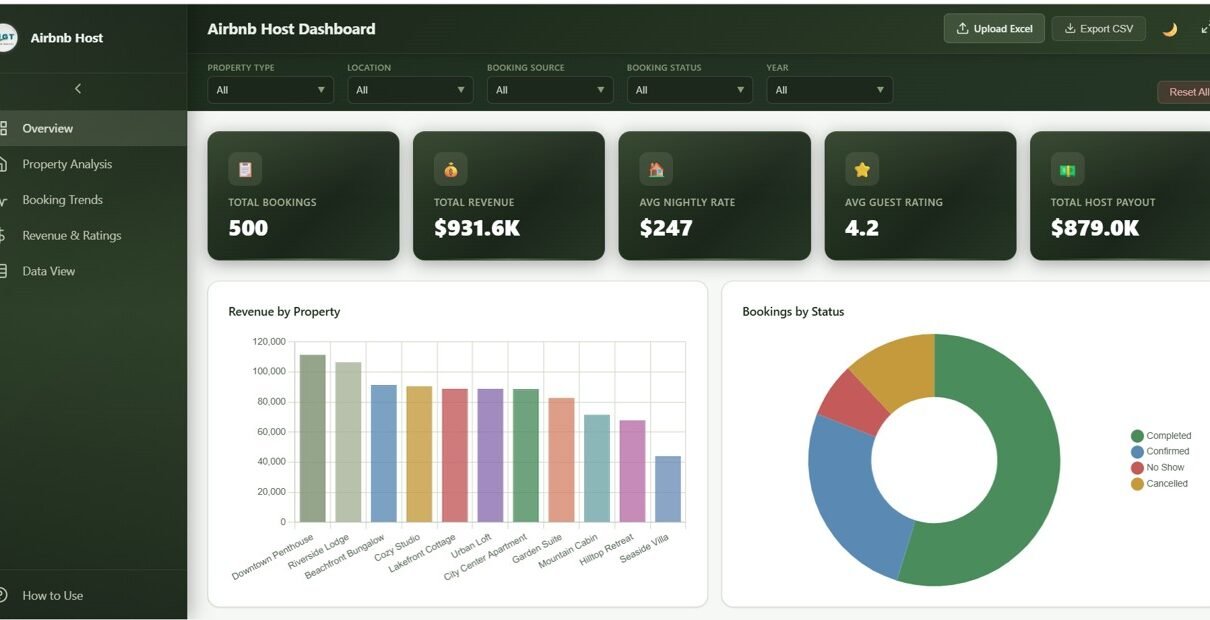
Airbnb Host Dashboard in HTML
Track Airbnb bookings, revenue, host payout, and guest ratings with the Airbnb Host Dashboard in HTML — a 5-page browser-based dashboard with 14 charts, global slicers, and CSV export. $12.99 one-time, no install required.
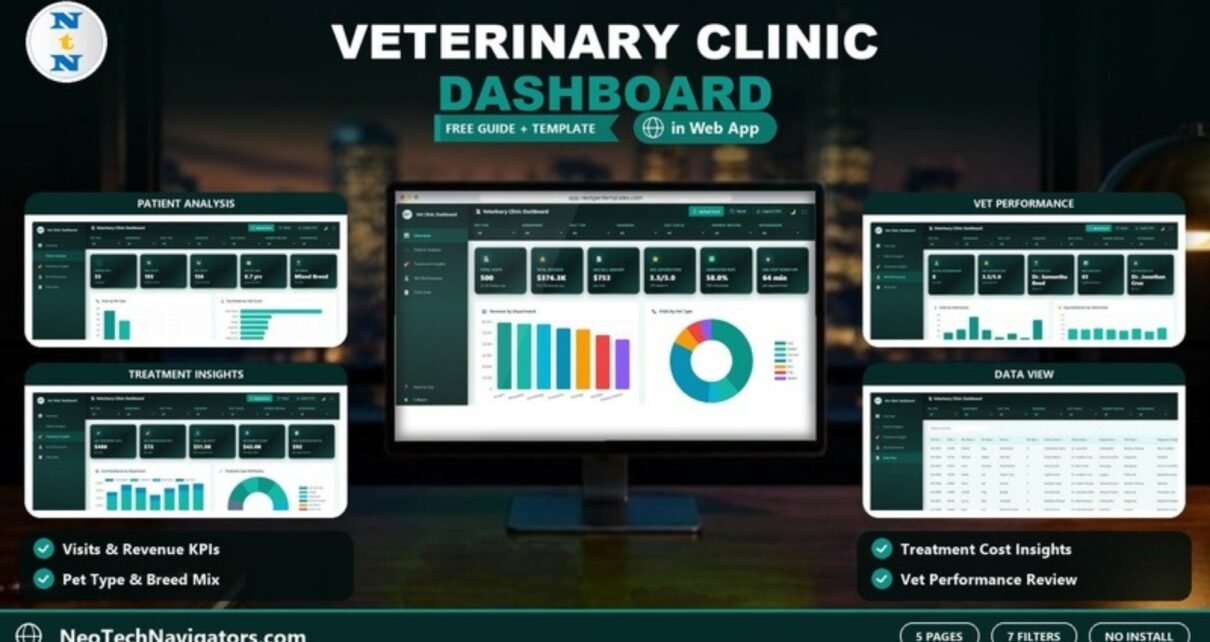
Veterinary Clinic Dashboard in HTML
A page-by-page guide to the Veterinary Clinic Dashboard in HTML: visits, revenue, satisfaction, pet mix, treatment costs and veterinarian performance across five browser pages with seven filters, Excel upload and CSV export.
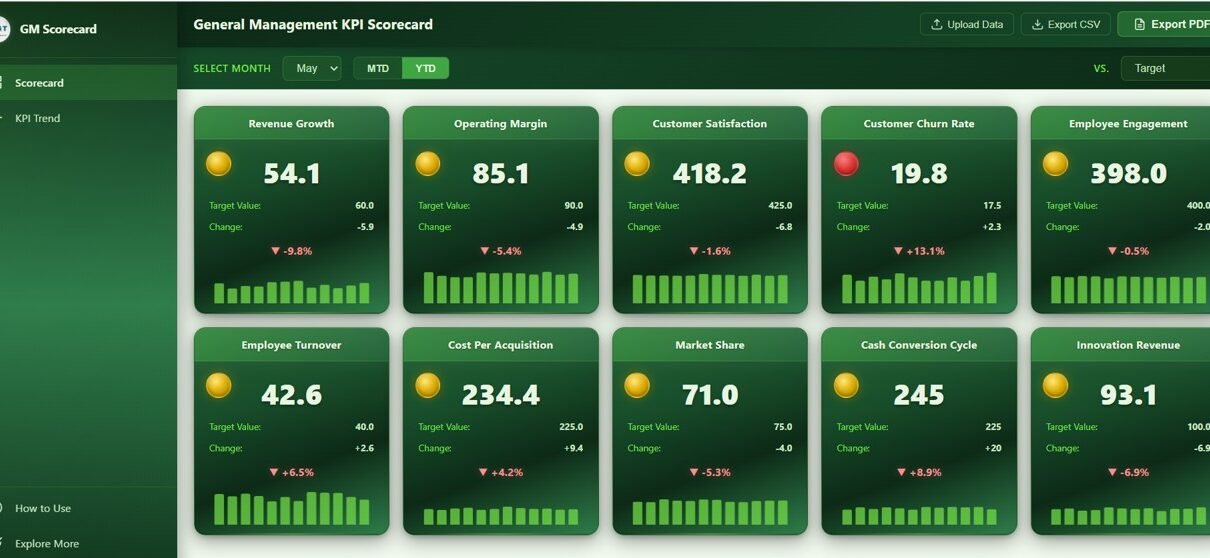
General Management KPI Scorecard in HTML
General Management KPI Scorecard in HTML — a premium browser-based executive scorecard template tracking 10 cross-functional management KPIs with traffic light indicators, sparkline trends, MTD/YTD toggle, and trend analysis charts for CEOs, general managers, and senior leaders.
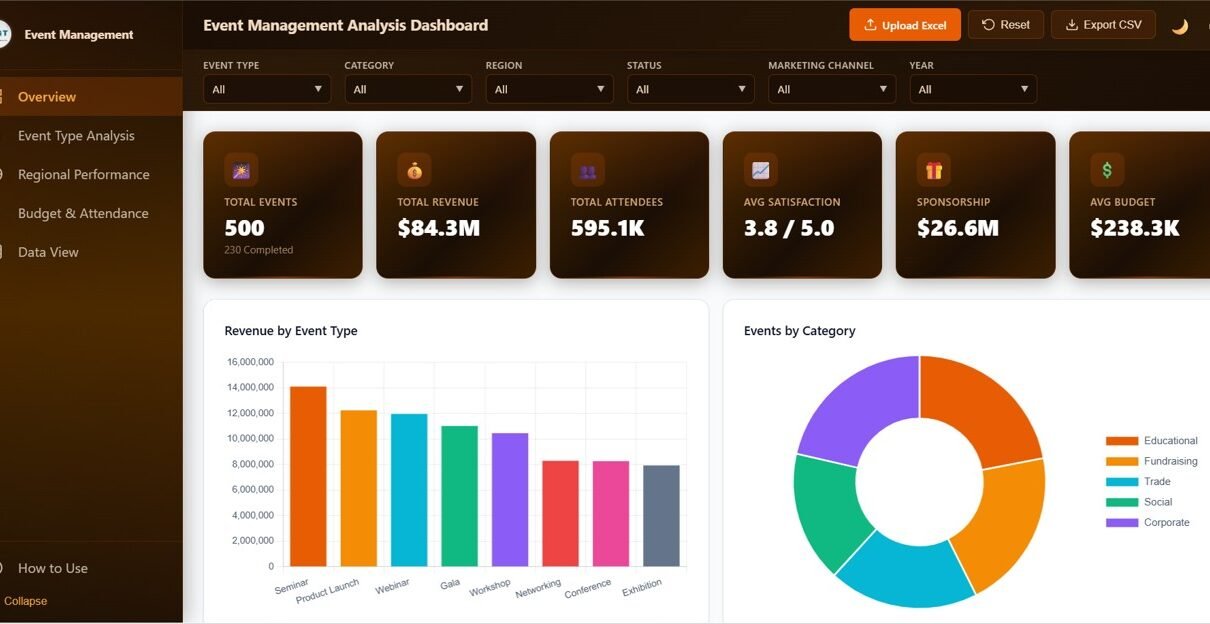
Event Management Analysis Dashboard in HTML
The Event Management Analysis Dashboard in HTML is a browser-based analytics template with 5 interactive pages — Overview, Event Type Analysis, Regional Performance, Budget & Attendance, and Data View — plus 6 KPIs and 20+ charts covering revenue, attendees, sponsorship, budget, and satisfaction. Works in any modern browser — no Excel or Power BI needed.
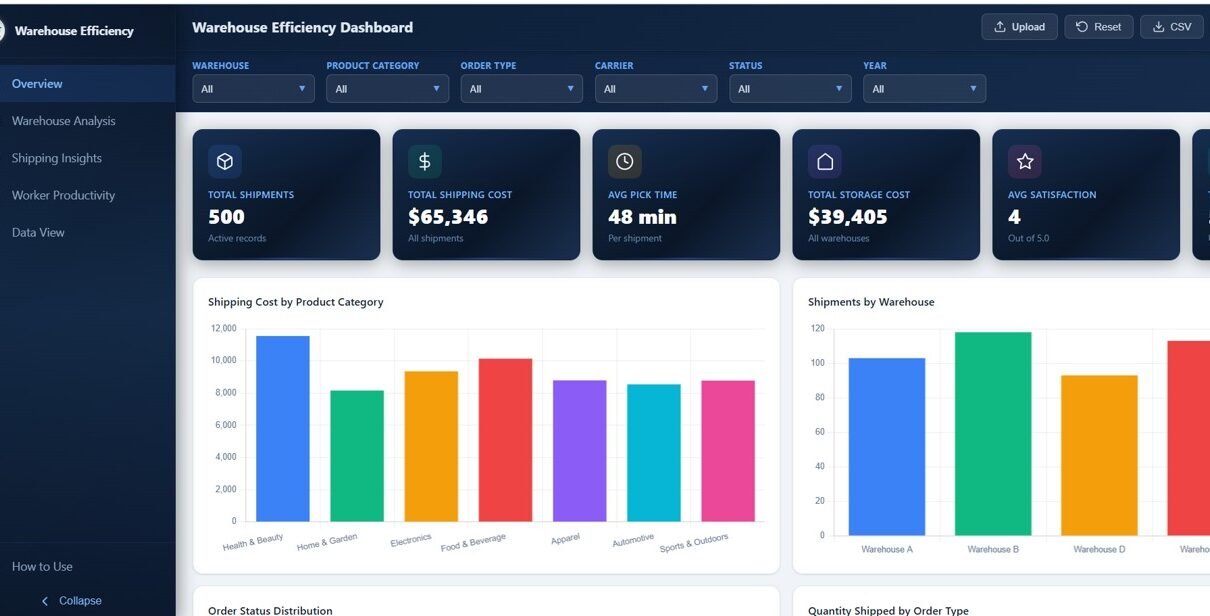
Warehouse Efficiency Dashboard in HTML
Warehouse Efficiency Dashboard in HTML with 5 interactive pages tracking shipments, storage costs, shipping insights, worker productivity, and a data view with CSV export.
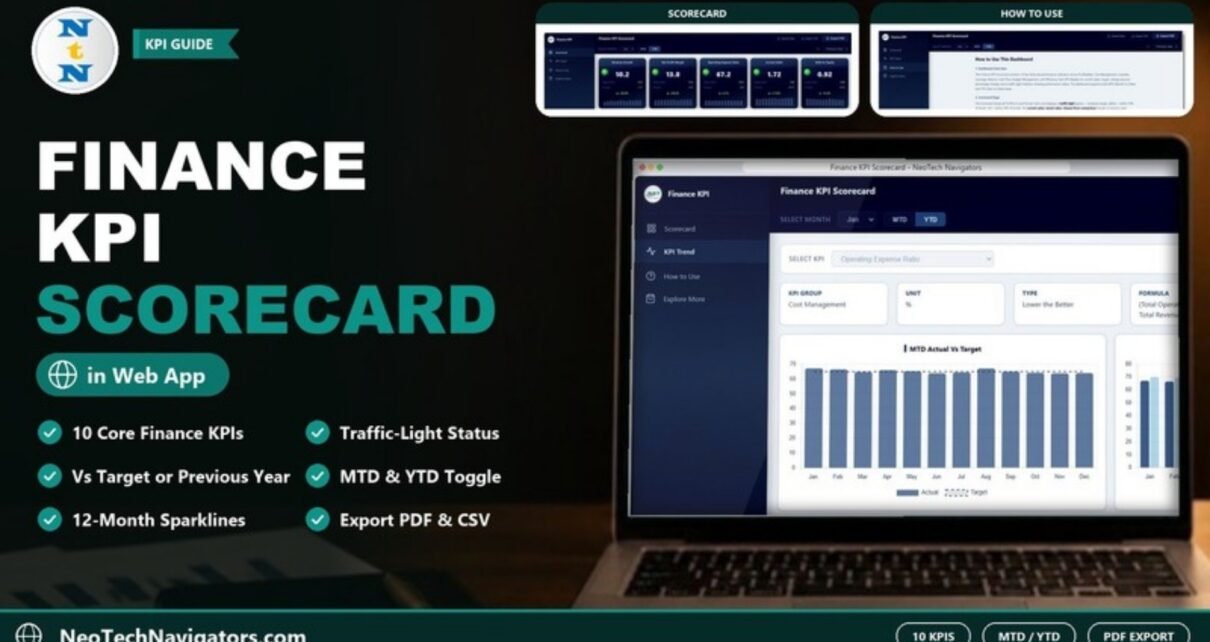
Finance KPI Scorecard in HTML
A browser-based Finance KPI Scorecard in HTML that shows ten financial KPIs with traffic lights, targets, prior-year changes, sparklines and four trend charts, with PDF and CSV export.
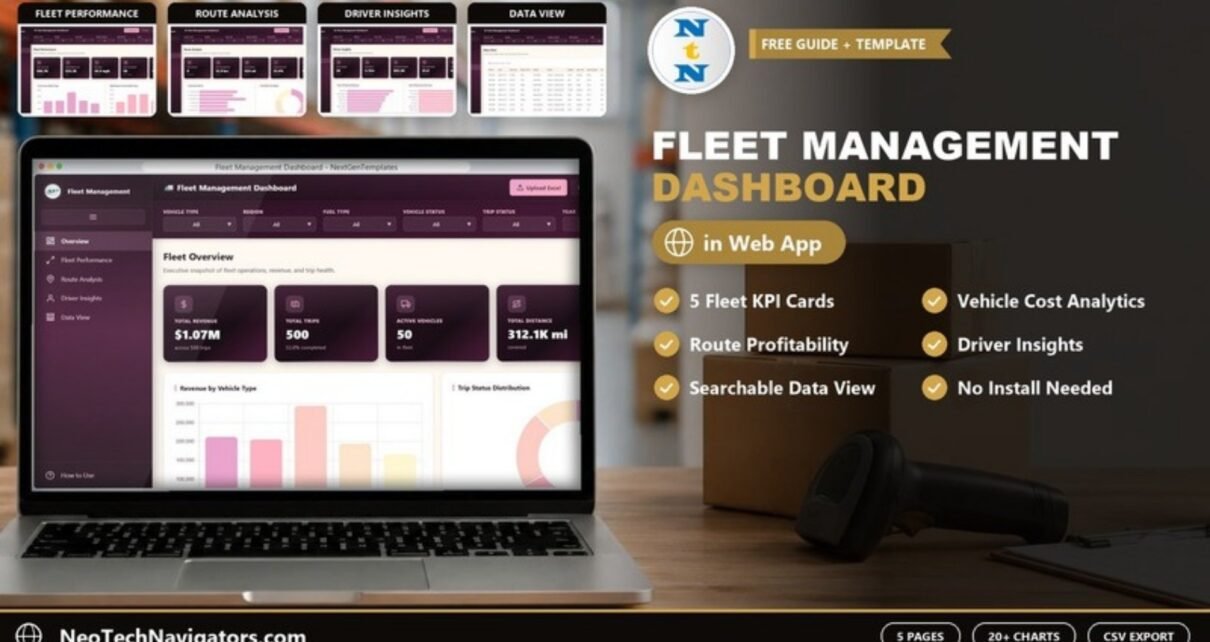
Fleet Management Dashboard in HTML
A browser-based Fleet Management Dashboard in HTML with Overview, Fleet Performance, Route Analysis and Driver Insights pages, 20 KPI cards, six filters, Excel upload and a searchable data table with CSV export.
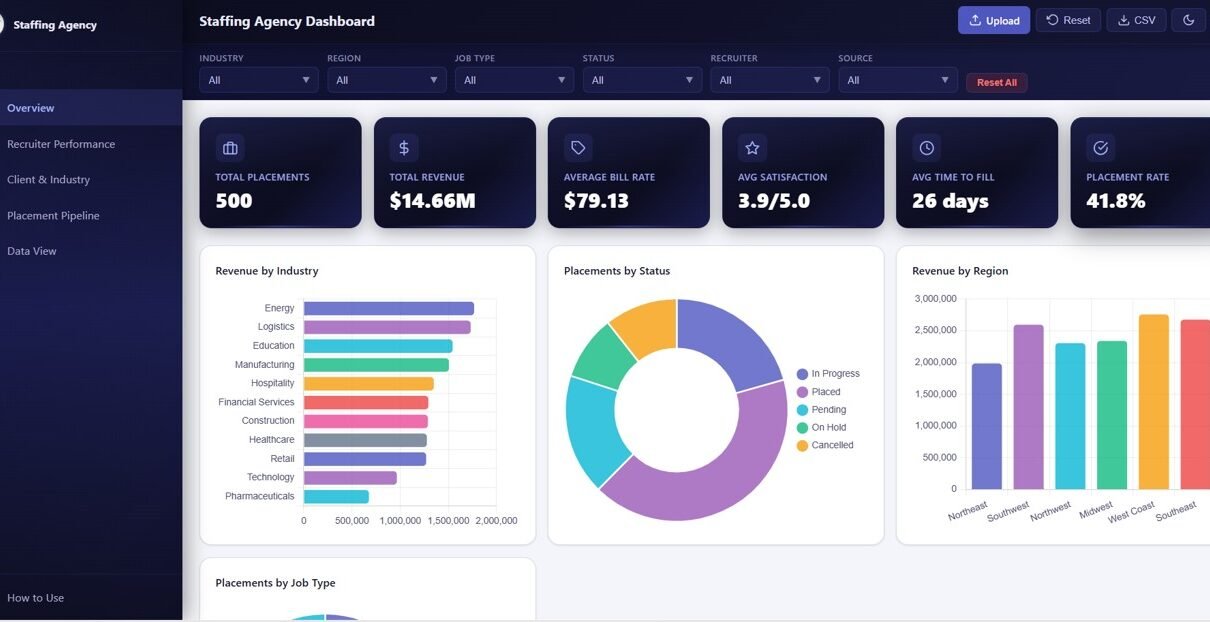
Staffing Agency Dashboard in HTML
Staffing Agency Dashboard in HTML with 5 interactive pages, 6 KPIs, recruiter performance tracking, client analysis, placement pipeline, data view, and CSV export.