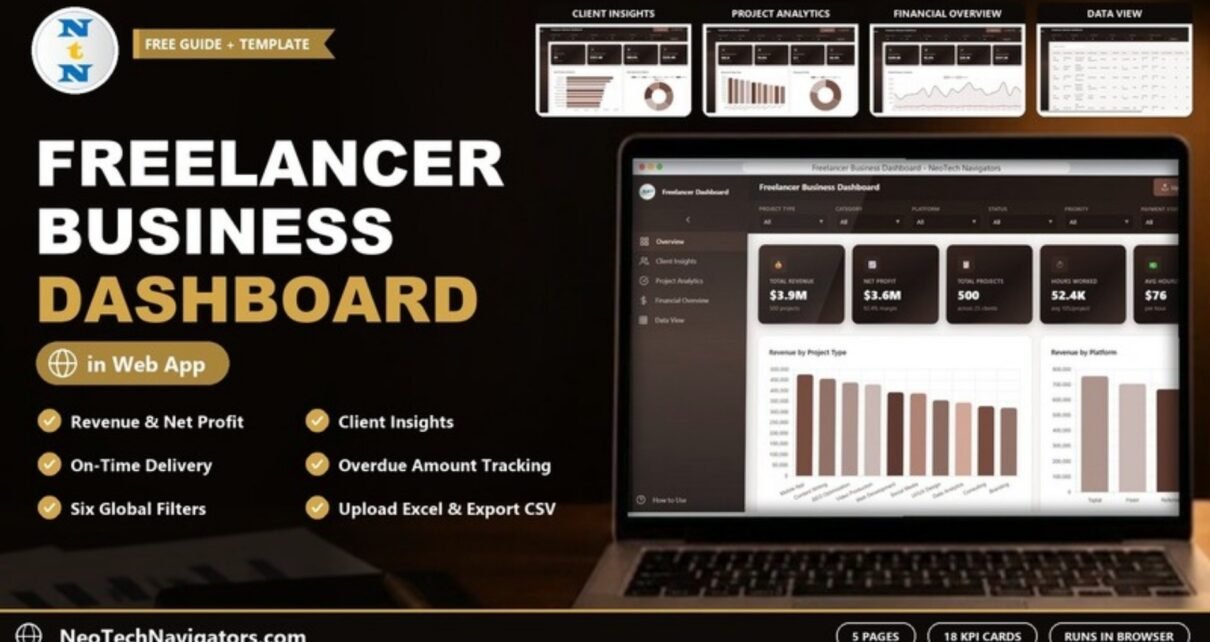
A browser-based Freelancer Business Dashboard in HTML with five pages, 18 KPI cards, six filters and a searchable project table that tracks revenue, profit, clients and overdue payments.
Online Tutorial for Data Analysis and Automation
A browser-based Freelancer Business Dashboard in HTML with five pages, 18 KPI cards, six filters and a searchable project table that tracks revenue, profit, clients and overdue payments.
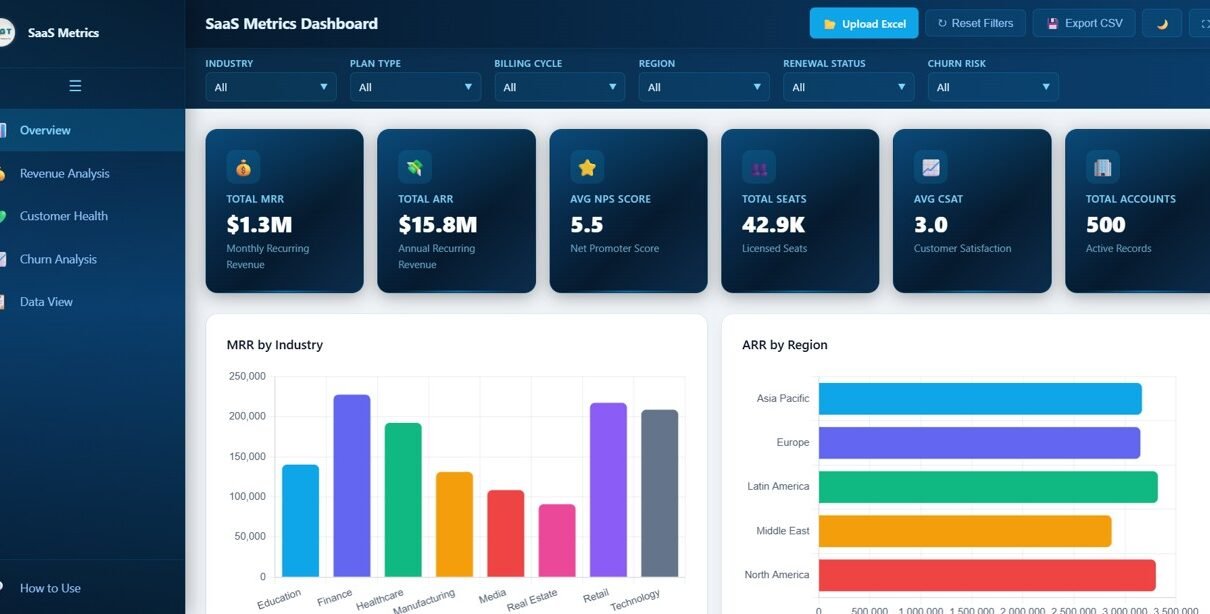
SaaS Metrics Dashboard in HTML with 5 interactive pages tracking MRR, ARR, NPS, CSAT, churn risk, and renewal status. Browser-based, zero installation required.
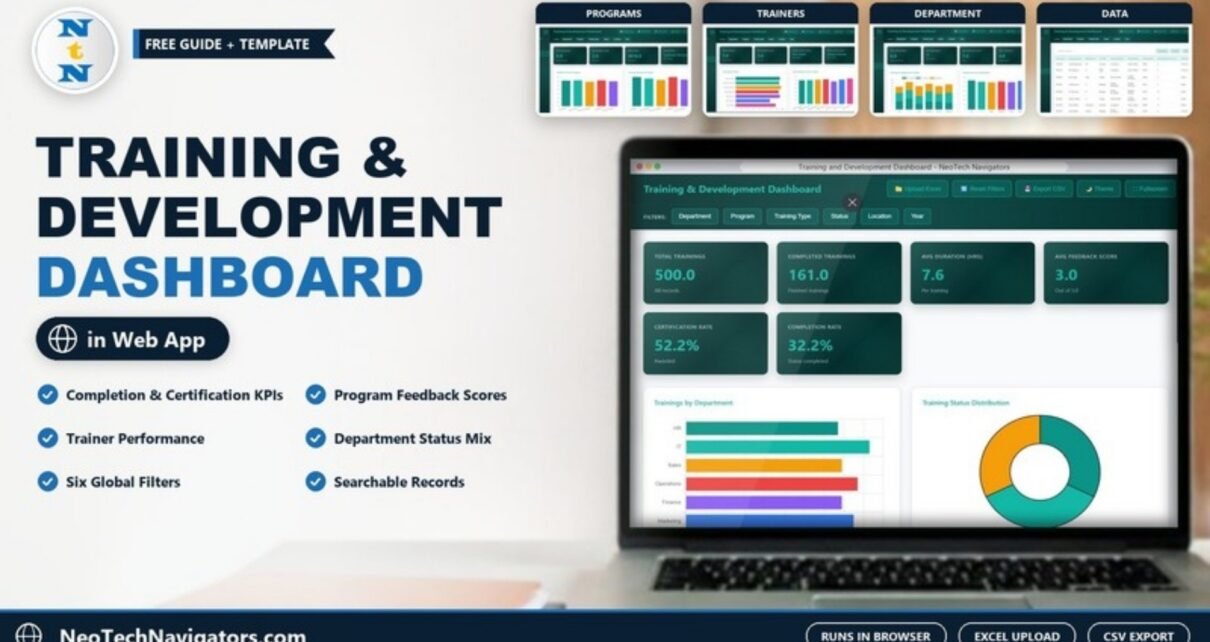
A page-by-page guide to the Training and Development Dashboard in HTML: completion, certification and feedback KPIs by programme, trainer and department, with filters, Excel upload and CSV export.
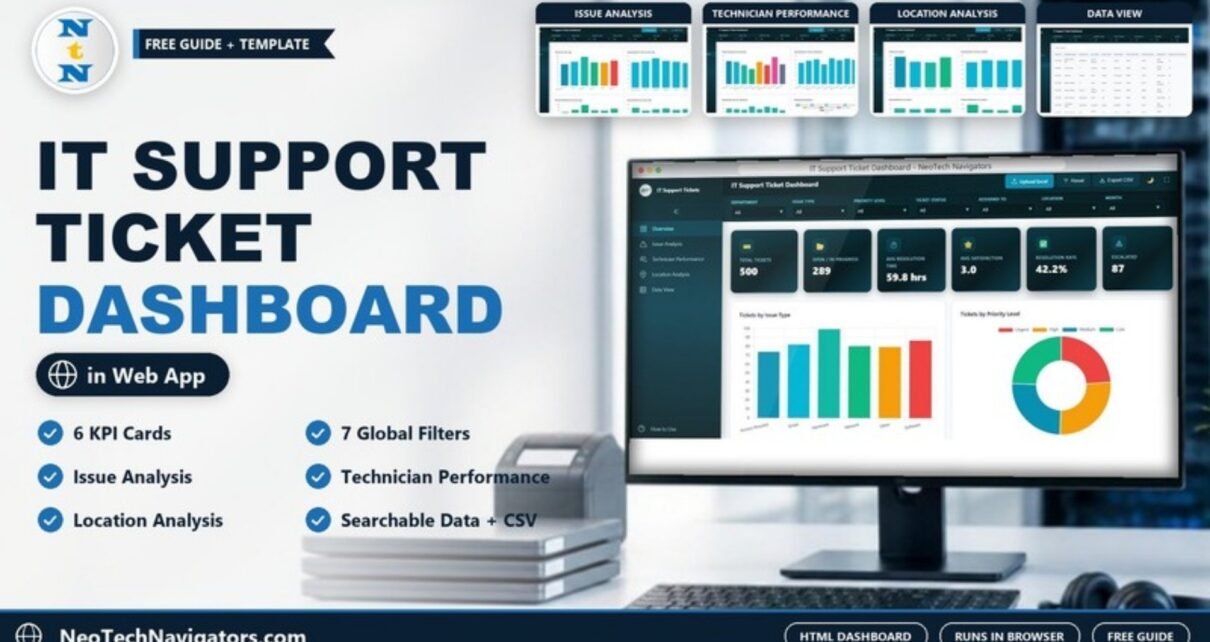
A browser-based IT Support Ticket Dashboard in HTML with six KPI cards, seven filters and pages for issue, technician and location analysis plus a searchable ticket table with CSV export.
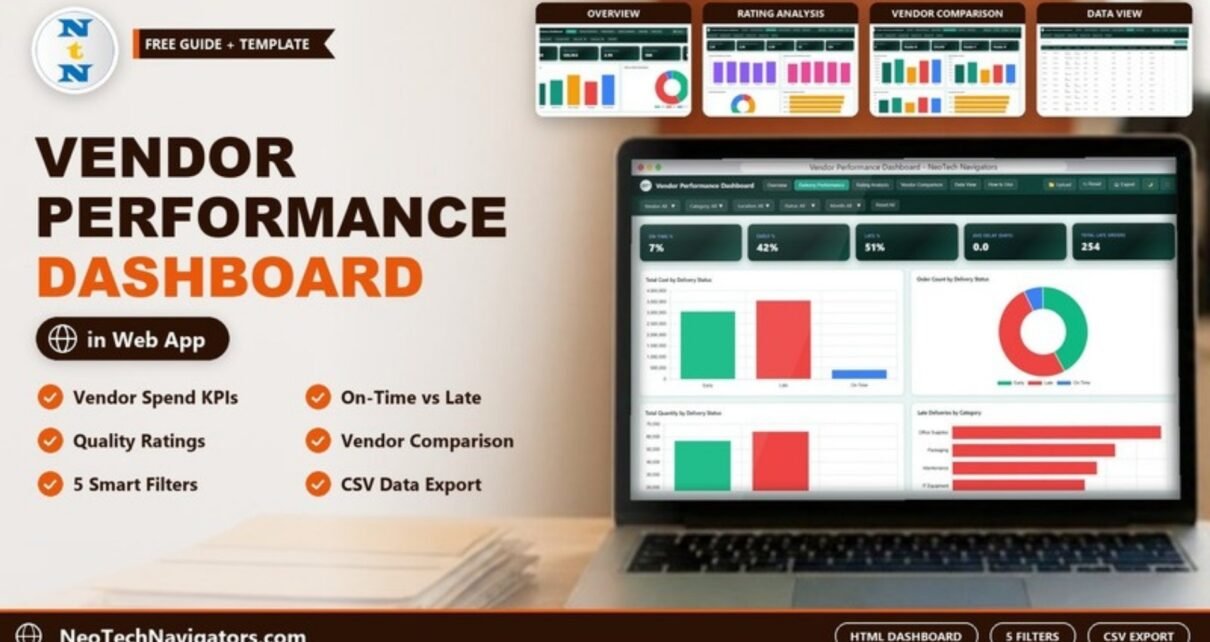
A walkthrough of the Vendor Performance Dashboard in HTML: KPI cards for cost, delivery and ratings, five analysis pages, vendor/category/location/status/month filters, CSV export, and how to use it with your own purchase-order data.
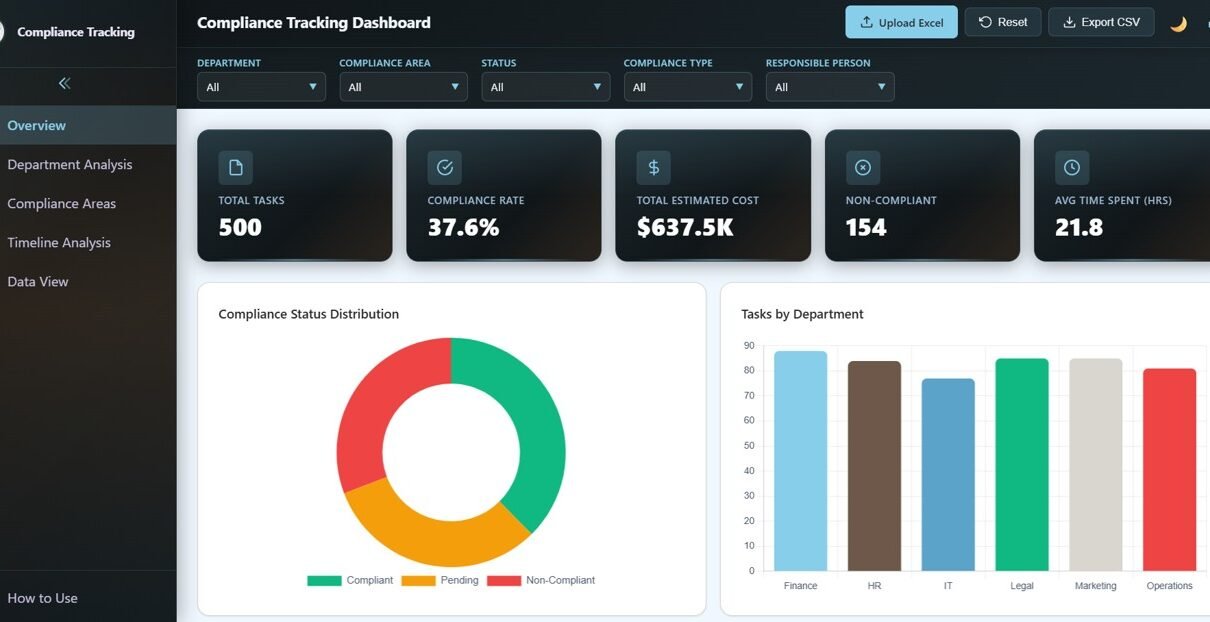
Compliance Tracking Dashboard in HTML with 5 interactive pages tracking compliance tasks, costs, departmental rates, timeline trends, and detailed data view with CSV export.

A walkthrough of the CRM Dashboard in HTML: five interactive pages for deals, win rate, account managers, industries and lead sources, the KPIs it tracks, its six filters and how to load your own pipeline data.
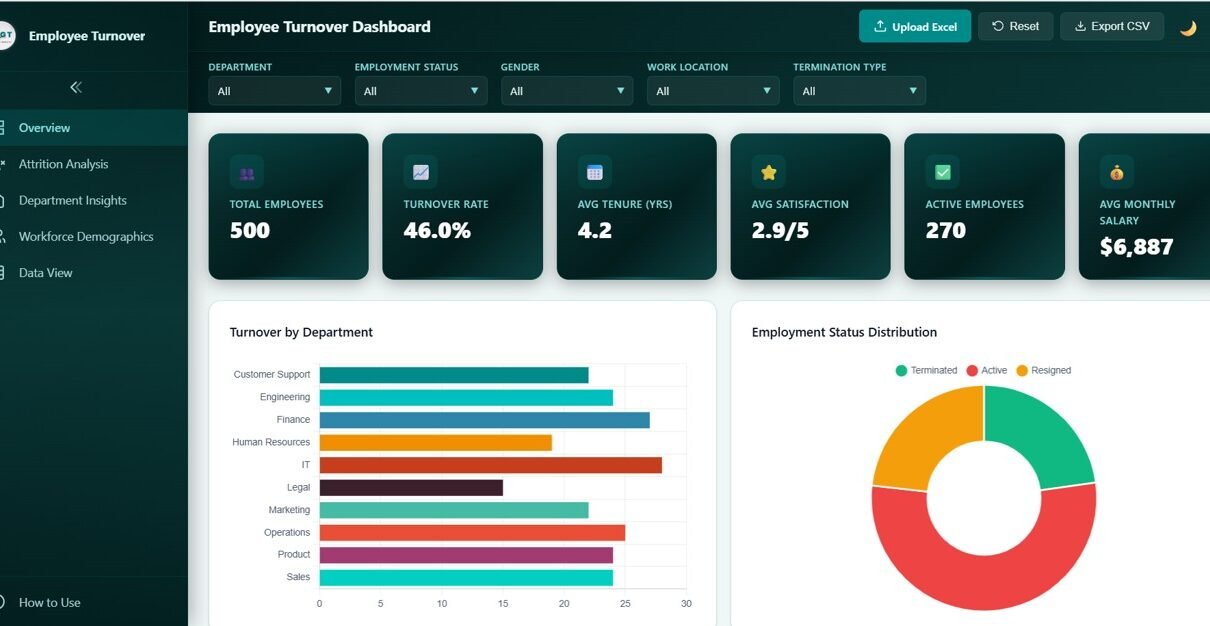
A browser-based Employee Turnover Dashboard in HTML with five pages, KPI cards, about 20 charts, five global filters and a searchable employee table with CSV export.
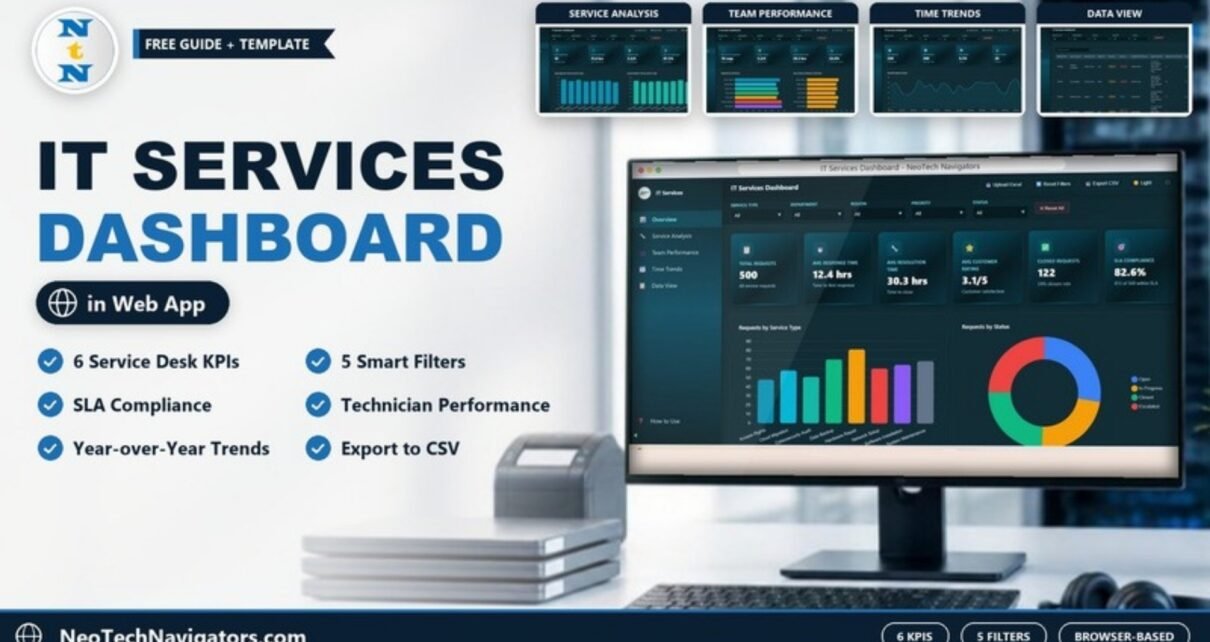
A page-by-page guide to the IT Services Dashboard in HTML: six service-desk KPIs, five filters, service, technician and time-trend analysis, and a searchable data view, all running in the browser.
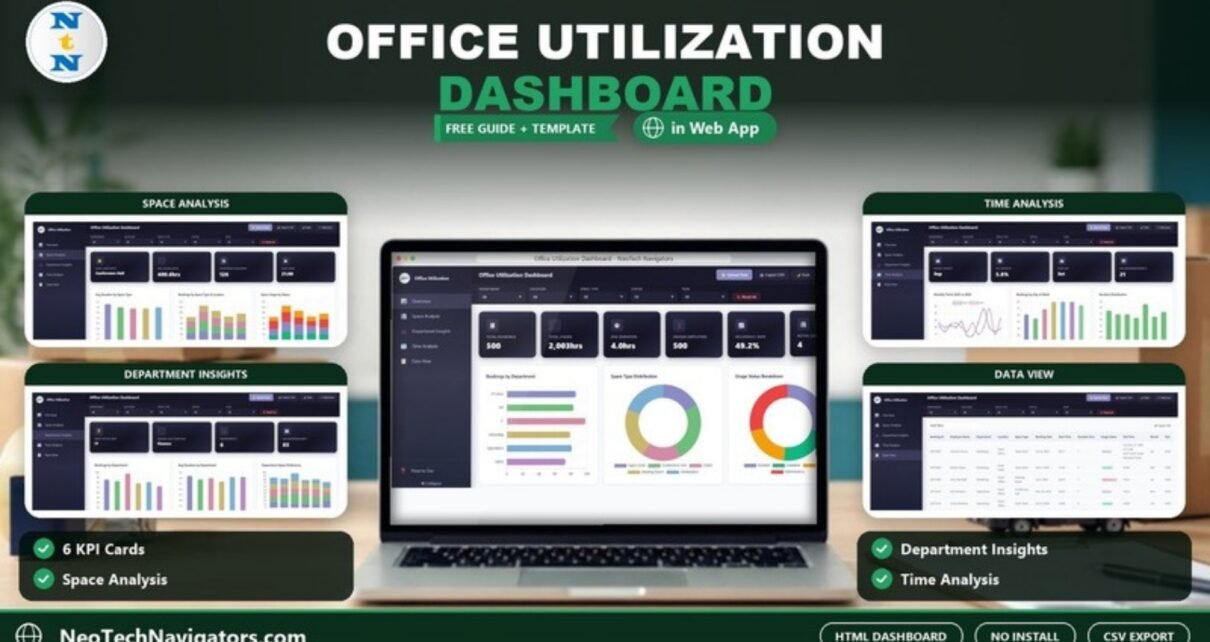
A walkthrough of the Office Utilization Dashboard in HTML: six KPIs including occupancy rate and total hours, the Space Analysis, Department Insights, Time Analysis and Data View pages, the filter bar and how to load your own booking data.